Andyʼs working notes
About these notesRaincloud plot
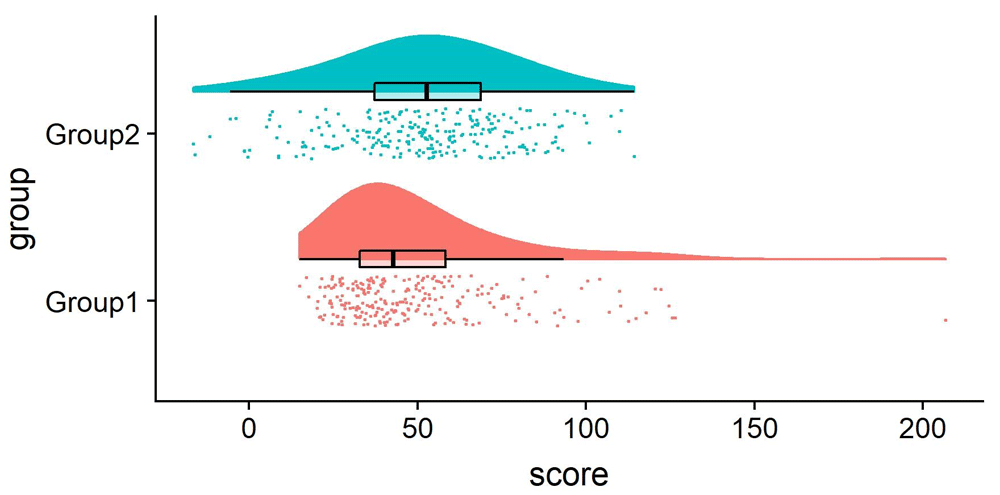
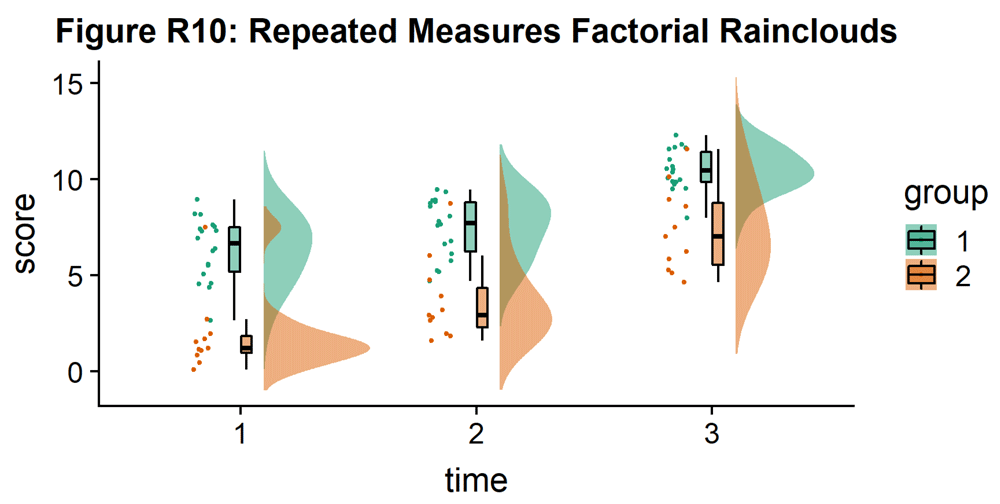
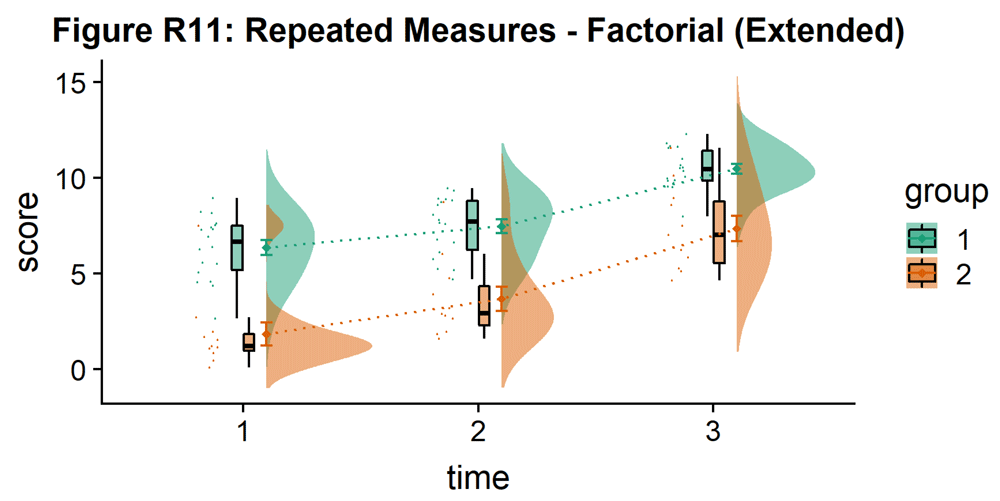
A combined half-violin plot, boxplot, and jitter plot which simultaneously displays a distribution’s density, aggregate statistics, and individual data points.

Some very nice density here:

Raincloud plots: a multi-platform tool for… | Wellcome Open Research
Visualizing Distributions with Raincloud Plots (and How to Create Them with ggplot2) - Cédric Scherer