Andyʼs working notes
About these notesLog: Preparing for FOO Camp talk 2020
Re-running the TTFT claim that 195 users have demonstrated 1 month on 80% of QCVC: it’s now 421. (Query)
How many people have 1 month demonstrated retention on all 4 essays? (80% of prompts)? 46. Query
Quick outline riff:
- What comes after the book? … Why are all the answers to this question so boring?
- Let’s talk about learning difficult subjects from a book—subjects like quantum computing.
- Complex ideas may be hard to learn in part because their components overflow working memory
- cogsci knows how to form memories effectively, but existing media don’t really do anything to facilitate that
- introducing Quantum Country
- show question-answering in context
- Testing effect
- describe review schedule notion
- this isn’t just flashcards:
- Spaced repetition memory systems are extremely efficient
- Effects of the mnemonic medium on reader memory
- retention vs. repetition
- time cost
- counterfactual
- qualitative feedback
- 421 readers have 1 month retention vs. grad course
- lots of systems use flashcards, but the key insight here is using them for conceptual knowledge
- also: narrative (The mnemonic medium gives structure to normally-atomized spaced repetition memory prompts)
- Spaced repetition memory systems can be used to prompt application, synthesis, and creation
- The mnemonic medium can help readers apply what they’ve learned through simple application prompts
- ==todo expand a bunch==
- more generally, we can think of this as an opportunity to extend the reading experience
- Spaced repetition systems can be used to program attention
- The mnemonic medium keeps readers in contact with material over time
- Timeful text
- the importance of memory
- Imagine meeting a person who told you they “had a broad conceptual understanding” of how to speak French, but it turned out they didn’t know the meaning of “bonjour”, “au revoir”, or “tres bien”. You’d think their claim to have a broad conceptual understanding of French was hilarious. If you want to understand a subject in any real sense you need to know the details of the fundamentals. What’s more, that means not just knowing them immediately after reading. It means internalizing them for the long term
- Deep understanding requires detailed knowledge of fundamentals
- Challenges of relying on natural repetition / projects:
- To learn a programming language, use it in real projects.
- This is good insofar as it’s good to use what you’re learning in creative projects, and it avoids the failure mode of people learning things “just in case”
- But it’s a limited perspective. If you’re curious about quantum computing, there’s probably no natural opportunity to apply it in a project. Even if you had such an opportunity, you’d want to accelerate the boring, awkward early phases in which you can’t do anything useful at all—so you can focus on the interesting part.
- chunking and chess
Today I’m doing an analysis of time spent vs. demonstrated retention. Query
My first attempt doesn’t seem to line up with the repetition-vs-time data: at 2 hours spent, it shows median prompts at 20 / 39 / 48 days. Yet my prior queries suggested that after 4 post-read repetitions, medians are at 67 / 78 / 84 days, and that this takes around 80 minutes. What accounts for this discrepancy? Perhaps how I’m counting time differs. I’m using 60s as the cutoff in my new query. In the old query it was also 60s. Hm…
OK, it’s excluding retries. Maybe those are adding a lot of time? Now I see only 14 people having reached 120m, and their medians are 38/46/66. Medians at 80m are 21/32/43. So retries really do account for a lot of time: maybe almost a third. Wow! I guess it makes sense, since you’re disproportionately spending time on retries. Query
Hm. This doesn’t present a great picture. More concerning is that I still don’t see anyone here with demonstrated retentions like those I was seeing in my by-repetition analysis. I’ll now pull those specific users and ask: how much time had they spent by the time they finished repetition 4?
This looks much better. Time to complete 95% of repetition, in minutes, 25th/50th/75th percentiles:
- 27/24/31
- 35/47/58
- 51/74/90
- 69/99/129
(Query, N=42)
Why is this distribution so different from the earlier one? I guess those users just aren’t reaching the fourth repetition? If I look at the users who finish their third repetition (Query, N=134):
- 21/29/39
- 39/54/68
- 59/79/98
It’s a bit higher—10-20%. But not radically higher.
I still don’t really understand why the original query’s looking so much different, but at least this lets me tell a reasonable story.
Another way to look at this is: what’s the per-prompt marginal cost to get to a repetition count?
- For users who have finished 3 repetitions (seconds):
- 5/9/16
- 12/19/31
- 18/28/46
- … 4 repetitions (in seconds, query):
- 5/8/14
- 10/17/28
- 16/25/42
- 23/35/56
Sounds about right. Fairly constant intervals, too.
OK. I think that’s good enough for a simple “does it work”?
Looking again at the efficacy experiment, one way to explain the results:
In the control group, most readers got a perfect score; almost none forgot more than two answers. But in the experimental group, about half of readers forgot three or more answers, and about a third of them forgot five or more (i.e. most of the questions).
Finished the query for demonstrated retention vs. repetition: Query
Only 36 new-schedule users have finished their fifth repetition (fourth post-essay… not sure how to standardize), which makes sense, since it’d take 4 months in the “happy” case. For these users:
- Median:
- Repetition 2: 5.5 / 6.0 / 7.0
- Repetition 3: 14.2 / 16.4 / 17.5
- Repetition 4: 31.7 / 33.4 / 41.2
- Repetition 5: 68.8 / 78.6 / 83.9
- 25th percentile:
- Repetition 2: 5.0 / 5.6 / 6.1
- Repetition 3: 13.8 / 14.0. / 14.6
- Repetition 4: 41.8 / 64.1 / 74.0
- Repetition 5: 23.8 / 33.4 / 42.0
- Fifth percentile:
- Repetition 2: 4.6 / 4.9 / 5.4
- Repetition 3: 5.7 / 7.3 / 8.8
- Repetition 4: 8.0 / 12.0 / 14.3
- Repetition 5: 11.8 / 17.4 / 26.0
The inversion from the fourth to the fifth repetition for the 25th percentile is very interesting—I wonder what that means. My instinct is that it means I’ve screwed up.
One big problem with this analysis is that it doesn’t include prompts which have no demonstrated retention. We should see much worse fifth percentile results in the first repetition.
Correcting for that produces likelier results (Query). Here, the fifth percentile prompts aren’t remembered at all in the second repetition, which makes sense. And the inversion from the fourth to the fifth repetition in the 25th percentile goes away—good. These results are promising. The 25th percentile looks much like the median. The 5th percentile isn’t that bad—it’s clearly climbing, just with a delay.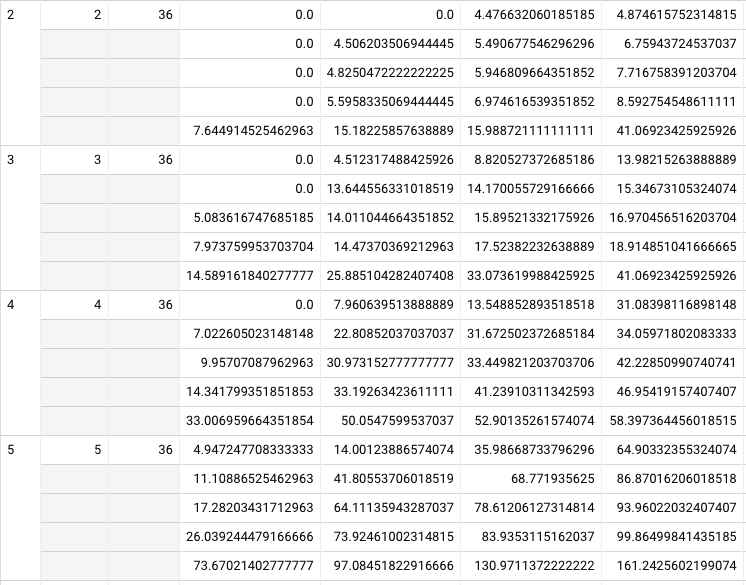
104 users have ~finished their fourth repetition (third post-essay). Their curve through the fourth repetition looks the same as that of the users who finished the fifth repetition. That’s good.
It’s a shame I don’t have samples for six repetitions. I think I can loosen the constraint that they’ve collected all the cards by their third session—maybe that’ll help.
Wow, OK, if I relax that constraint, 553 people have finished their fourth repetition. But the numbers look implausibly awful by comparison: medians at 8.0 / 9.1 / 30.8 by repetition 4, vs. 32.0 / 37.3 / 43.4 with the constraint. That’s… not really plausible to me. Why? Query
Oh, it’s because I’m including original-schedule users. Having fixed that, I get 139 users who’ve ~finished their fourth repetition, and their results are consistent with the 104. (Query). I get 42 users who have finished repetition 5. No significant change to the earlier results—just more samples.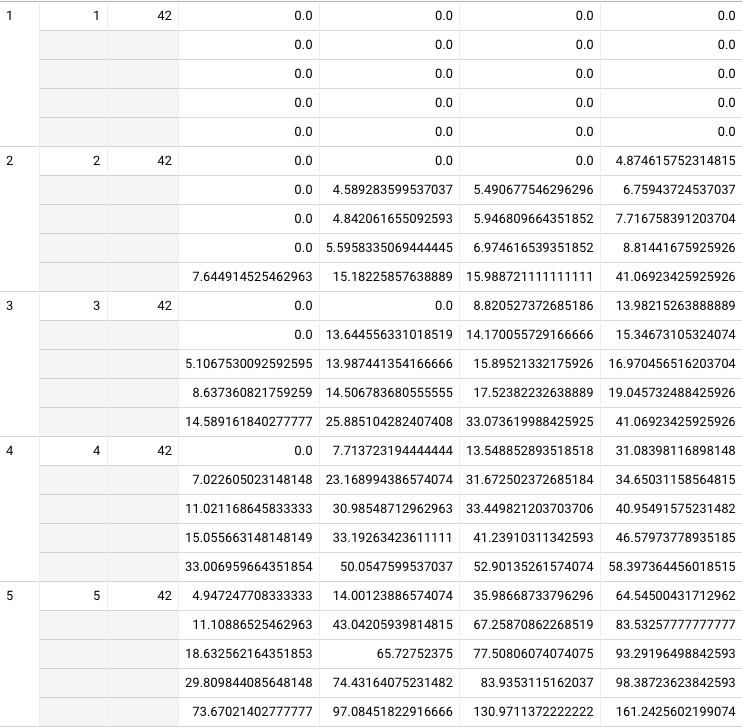
The results (green = median, blue = 25th, red = 5th percentile prompts):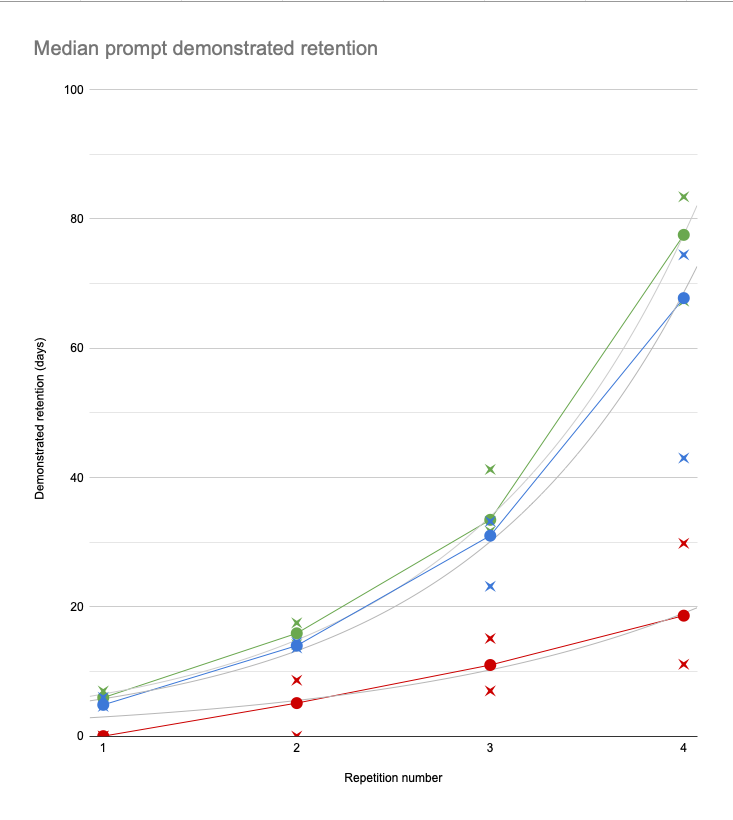
So after 4 repetitions (standardizing now on post-essay repetitions), most users have successfully remembered the answers to most prompts for at least two and a half months. Most users have remembered the answers to 3/4 of the prompts for at least two months. And most users have successfully remembered the answers to 95% of prompts for around three weeks.
Another way to look at this is by review session. Query The challenge here is that we must insist that users collected all the prompts by the third review session. This makes it hard to line up with the repetition data, but it’s certainly more pessimistic. By review session 15, median prompts are at 24 / 48 / 75 days.
Increasing the threshold to session 20, the median prompt is up to 26 / 50 / 82 days, but we’ve only got 16 users to sample from, so I don’t really trust this data. The discrepancy with the repetition number data suggests that the initial constraint is too much. Query
The next thing to analyze will be time spent. 15 sessions seems like a lot. Is it? Are most of them quick sessions? If I analyze by time spent, what constraint should I use on collection? “Read QCVC before studying for an hour”? Not sure what makes sense here. This’ll take some time, so I’ll start tomorrow.
Other things I’m curious about: “what’s the marginal ‘gain’ in each review session”? How does accuracy vary with time spent?
It’s clear to me that I’ll want to be able to present some basic information about the effects of Quantum Country, despite the broader aspirations Michael and I have been discussing around trying to understand what’s happening more fundamentally.
I’d like to use “demonstrated retention” as a metric, meaning “your best score.” For that to be valid, I need to know what the “regression rate” is. If you’ve achieved a “best score,” how durable is that? If it’s durable almost all of the time, then I’m not too worried. I’m pretty sure I’ve done this analysis before in the context of retry impact: (Superseded) Lapsed question accuracy remains iffy, despite retry and interval-shortening
OK, but that analysis was focused exclusively on lapses from two weeks. How often do they happen in general? (Query). Still around 78% accuracy after a lapse. I notice that the total N is quite low: about 5,400 reviews-after-lapses for new-schedule users. Does that square? Not really.
There are ~290k new-schedule reviews (excluding retries and in-essay reviews), and 43k forgotten responses (Query). I guess my earlier query was more restrictive, since it only included lapses above two weeks. With that added constraint, I get 111k reviews and 8k reviews-after-lapses (Query). What accounts for the 2,600 review-after-lapse gap? Are all those people churning before reviewing their lapsed prompt? That just doesn’t seem plausible to me. Or maybe the issue is that many of them are simply not due yet? If I require the next prompt to have been due at least for a week, I get 7,765 forgotten prompts (Query). That’s still a big gap. What about just prompts after retry was enabled? Doesn’t really change the number. OH! Maybe it’s the in-essay reviews? If I include those in my original analysis, I get about 5,600 reviews-after-lapses—slight increase (Query)
I guess our churn rate is high enough that “a quarter of forgotten prompts aren’t reviewed again” does sound about right. That means there’ll be pretty significant survivorship bias in the review-after-lapse pool, but I’ll roll with it for now and see what I can see.
Maybe let me just ask this a different way. How often do prompts’ intervals drop below their best intervals?
- A single prompt regressing 3+ times has only happened 87 times, so that’s quite rare. Regressing twice is relatively more common: 620 prompts. That’s still quite rare, though, since we’re talking about 290k reviews. Query All in all, 7,069 prompts have regressed at least once. That’s a substantial number, given how concentrated inaccuracy is, but it’s not overwhelming.
- The 10th percentile user has regressed 14% of their prompts at least once. The 50th percentile user has regressed 1% of their prompts at least once. (Query) So another way to put this is that with quite high probability, once a prompt has been remembered at a particular interval, it won’t be forgotten at that interval. OK, I’m reasonably satisfied. (Here I’ve limited the sample to users with at least 50 prompts > 5 days, which is 1134 people).
- Probably this shakes out quite differently by longevity, and most of this pool of users hasn’t done many hundreds of reviews. But it’s a good intuition.
So… now that I know that, let’s look at distributions of demonstrated retention vs. session count, time spent, and repetition number.
Made a bunch of progress analyzing demonstrated retention vs. repetition count here, but I still need to restrict it to include only users who have completed the nth repetition with ~all their prompts. As it stands, higher repetitions are artificially diluted because they consist disproportionately of “troublesome” prompts.