Andyʼs working notes
About these notesLog: Quantum Country analysis
==Remember:== Recall rates are a misleading proxy for more meaningful goals of the mnemonic medium
Question queue:
- 2022-01-27: are people who forget a lot more likely to churn?
- 2022-01-20: 1-day “make-up” sessions rather than 5-day (as in aggressiveStart) yields higher accuracies in that session (Quantum Country users who forget in-essay exhibit sharp forgetting curves), but what does that mean in terms of the overall schedule? We’re seeing spacing effect vs. some kind of “correctness” reinforcement effect here… can I use this to create any kind of holistic measure? measure “stability”?
- 2022-01-20: Plot per-card forgetting chart like the one in QCVC questions are initially forgotten at very different rates for initially-forgotten cards, to reinforce Quantum Country users who forget in-essay exhibit sharp forgetting curves
- 2022-01-14: Make a per-card response time plot, segmented by condition.
- 2022-01-14: Examine the effect of initial delays on compliance.
- 2021-03-09: Do in-essay response times predict in-essay accuracy? That is, can we use them to identify prior ability?
- 2021-03-03: Does response time predict next question accuracy? If I take a long time to think about a forgotten response am I more likely to remember it next time? Or the reverse?
- Look at question correlations: can we use them to see dependencies?
2022-06-28
Updating QC data. 20220628094431
Not much change. Even less forgetting now!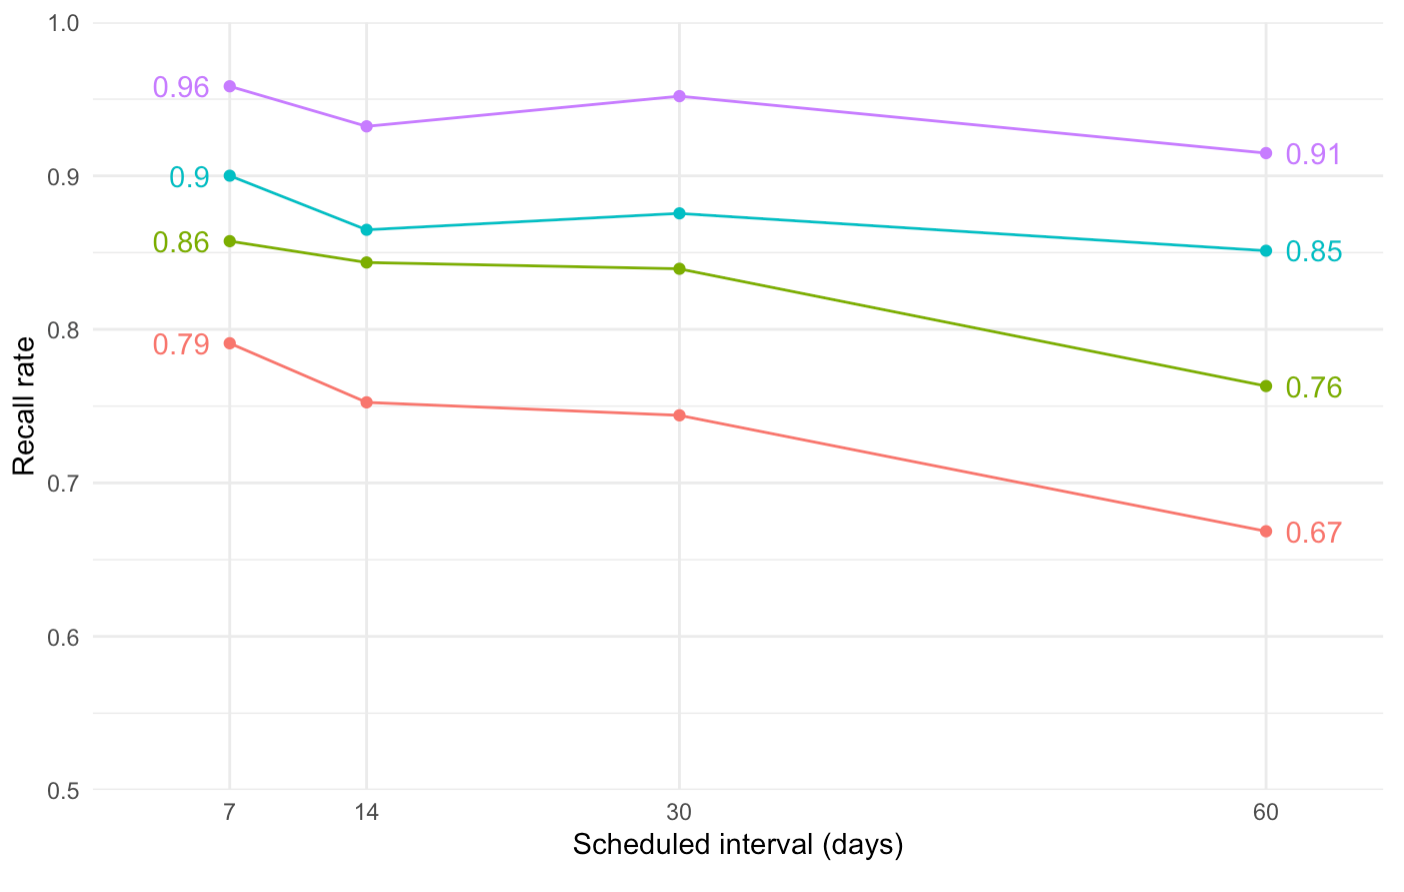
(vs, in February):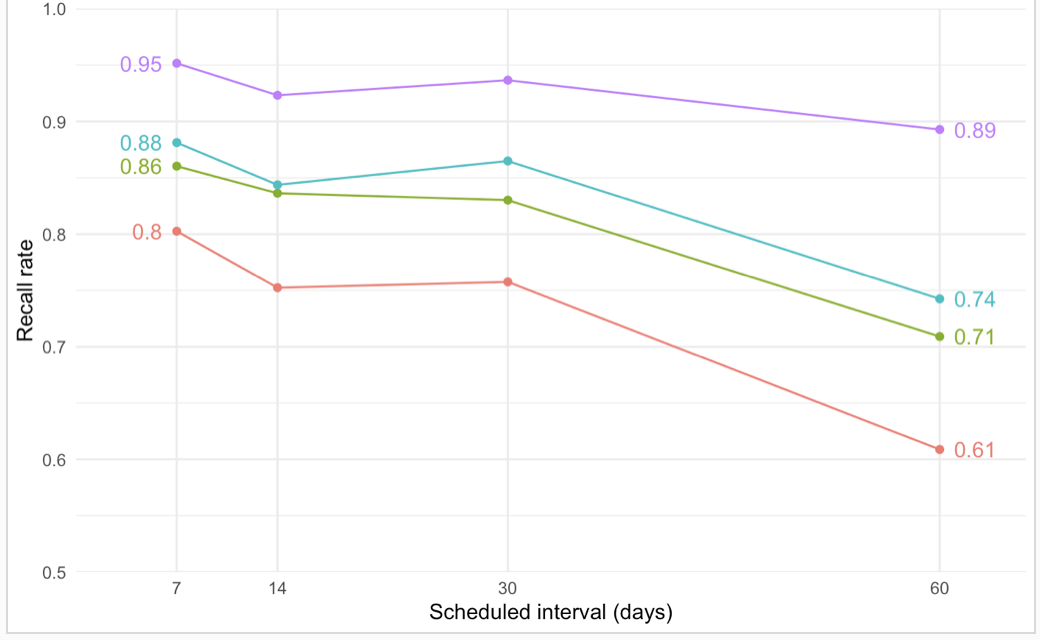
At least the 30 day cohort is behaving a little more sanely.
2022-02-24
More detailed plots which more or less tell the same story as what I narrated on 2022-02-24: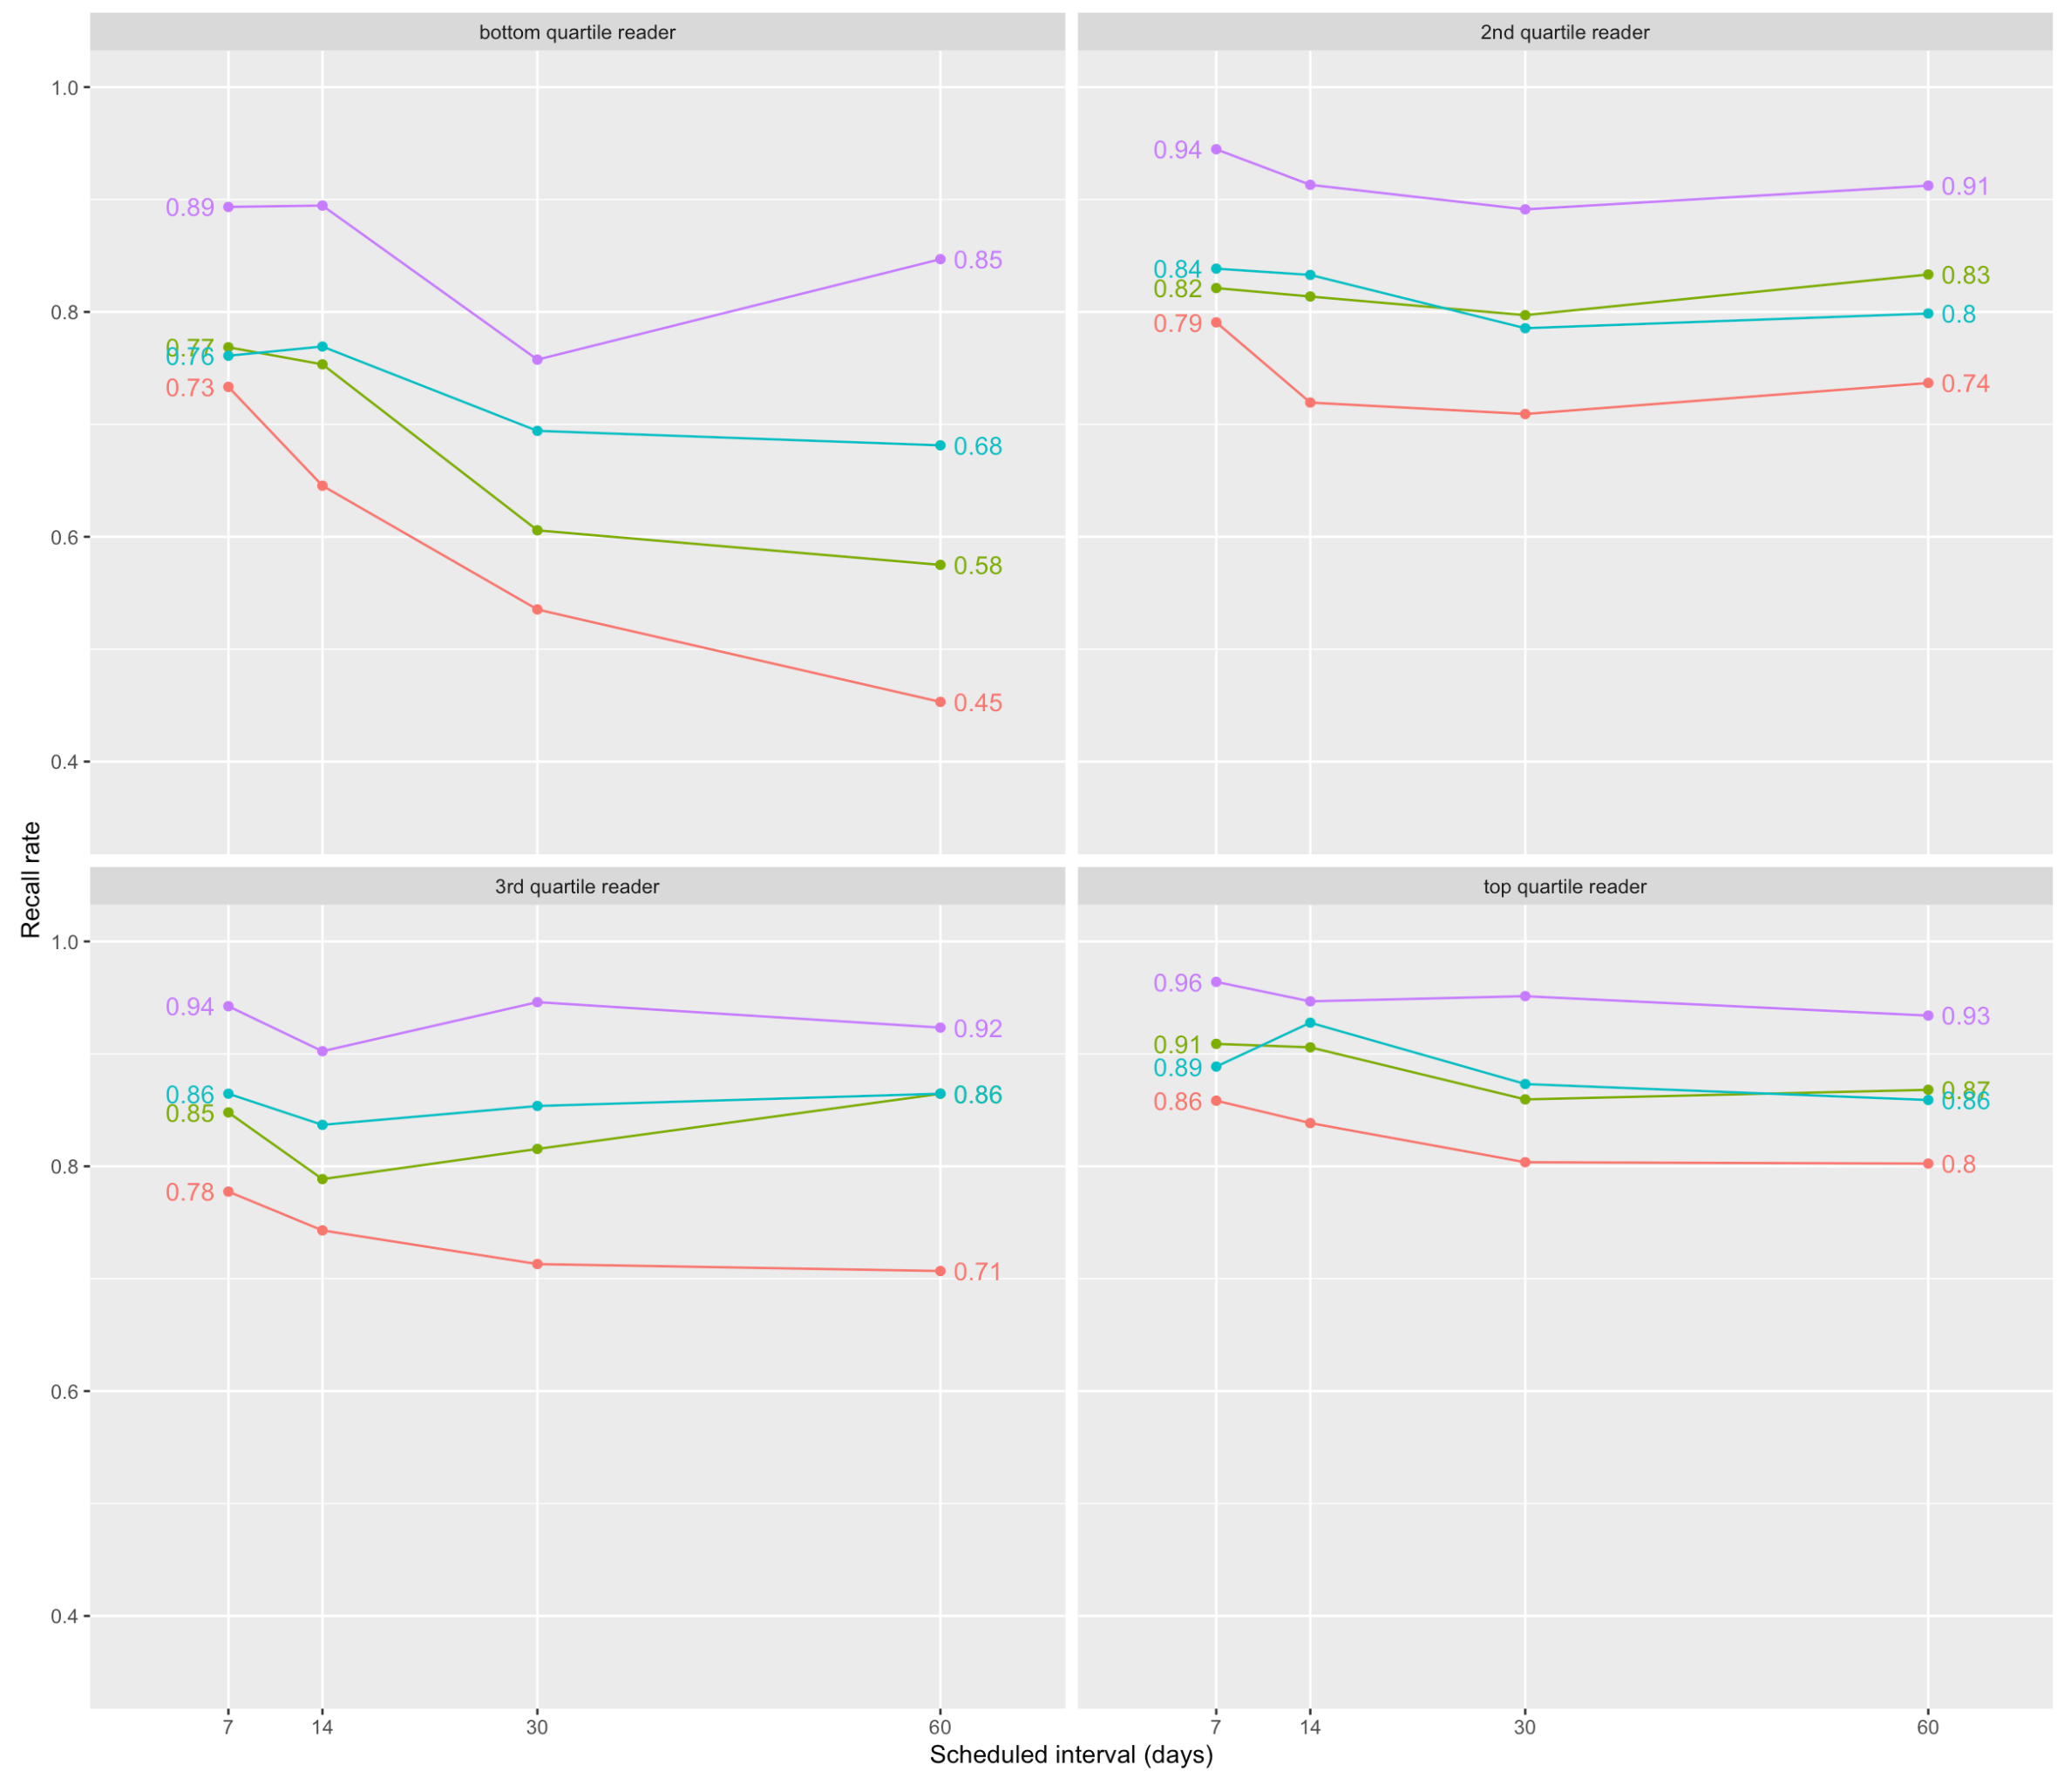
Note that the bottom-quartile 60 day data here comprises only about 6 users. And this data is quite skewed because I’m not including only people who completed an entire first review.
Using only those who finished their first repetition, I get a sharper story: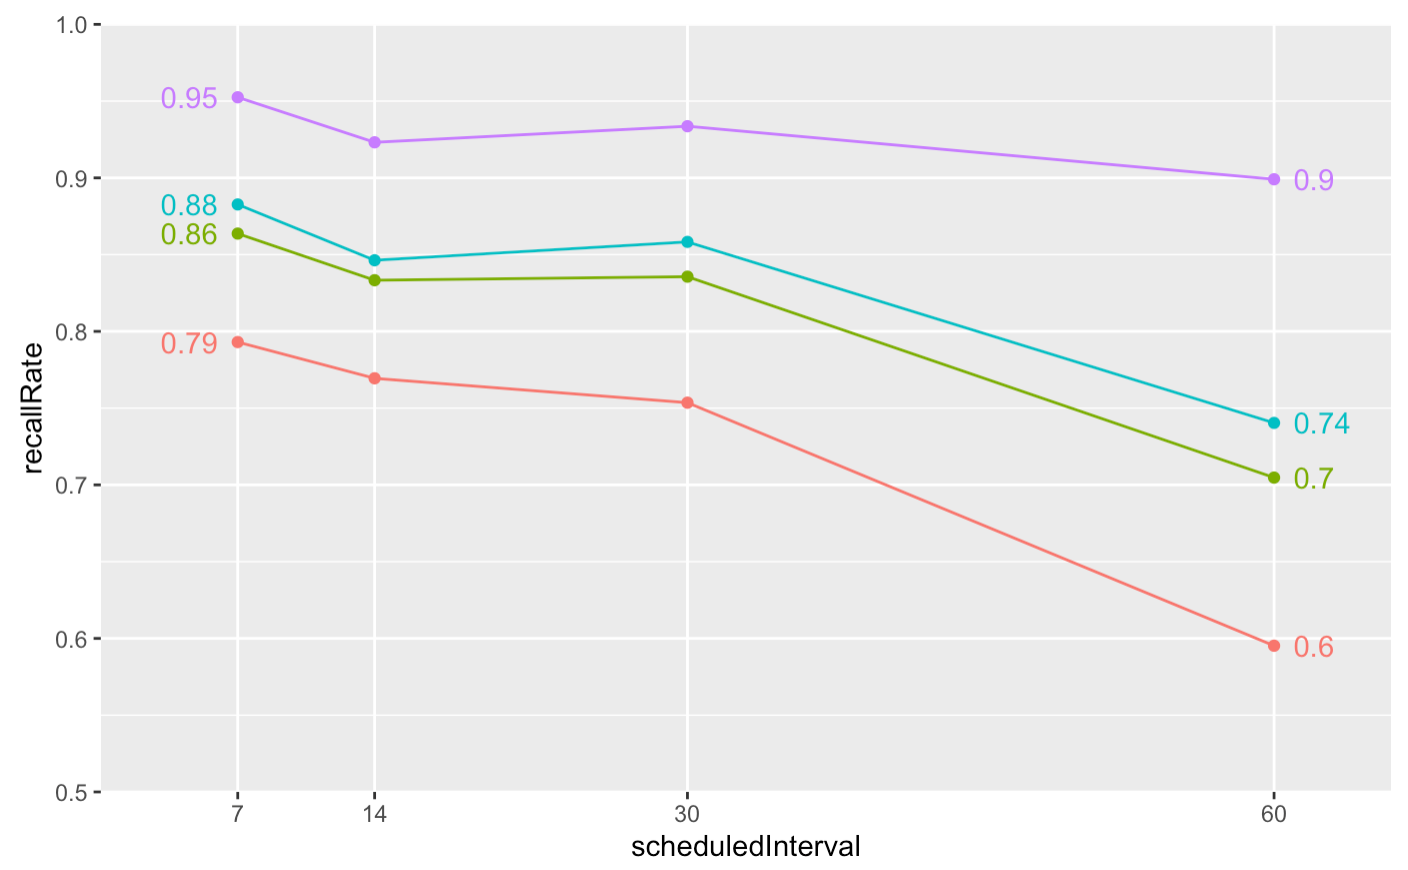
The trouble here is that I only have 4 (!!) data points for the 60-day mark.
2022-02-17
Plotted time costs by repetition: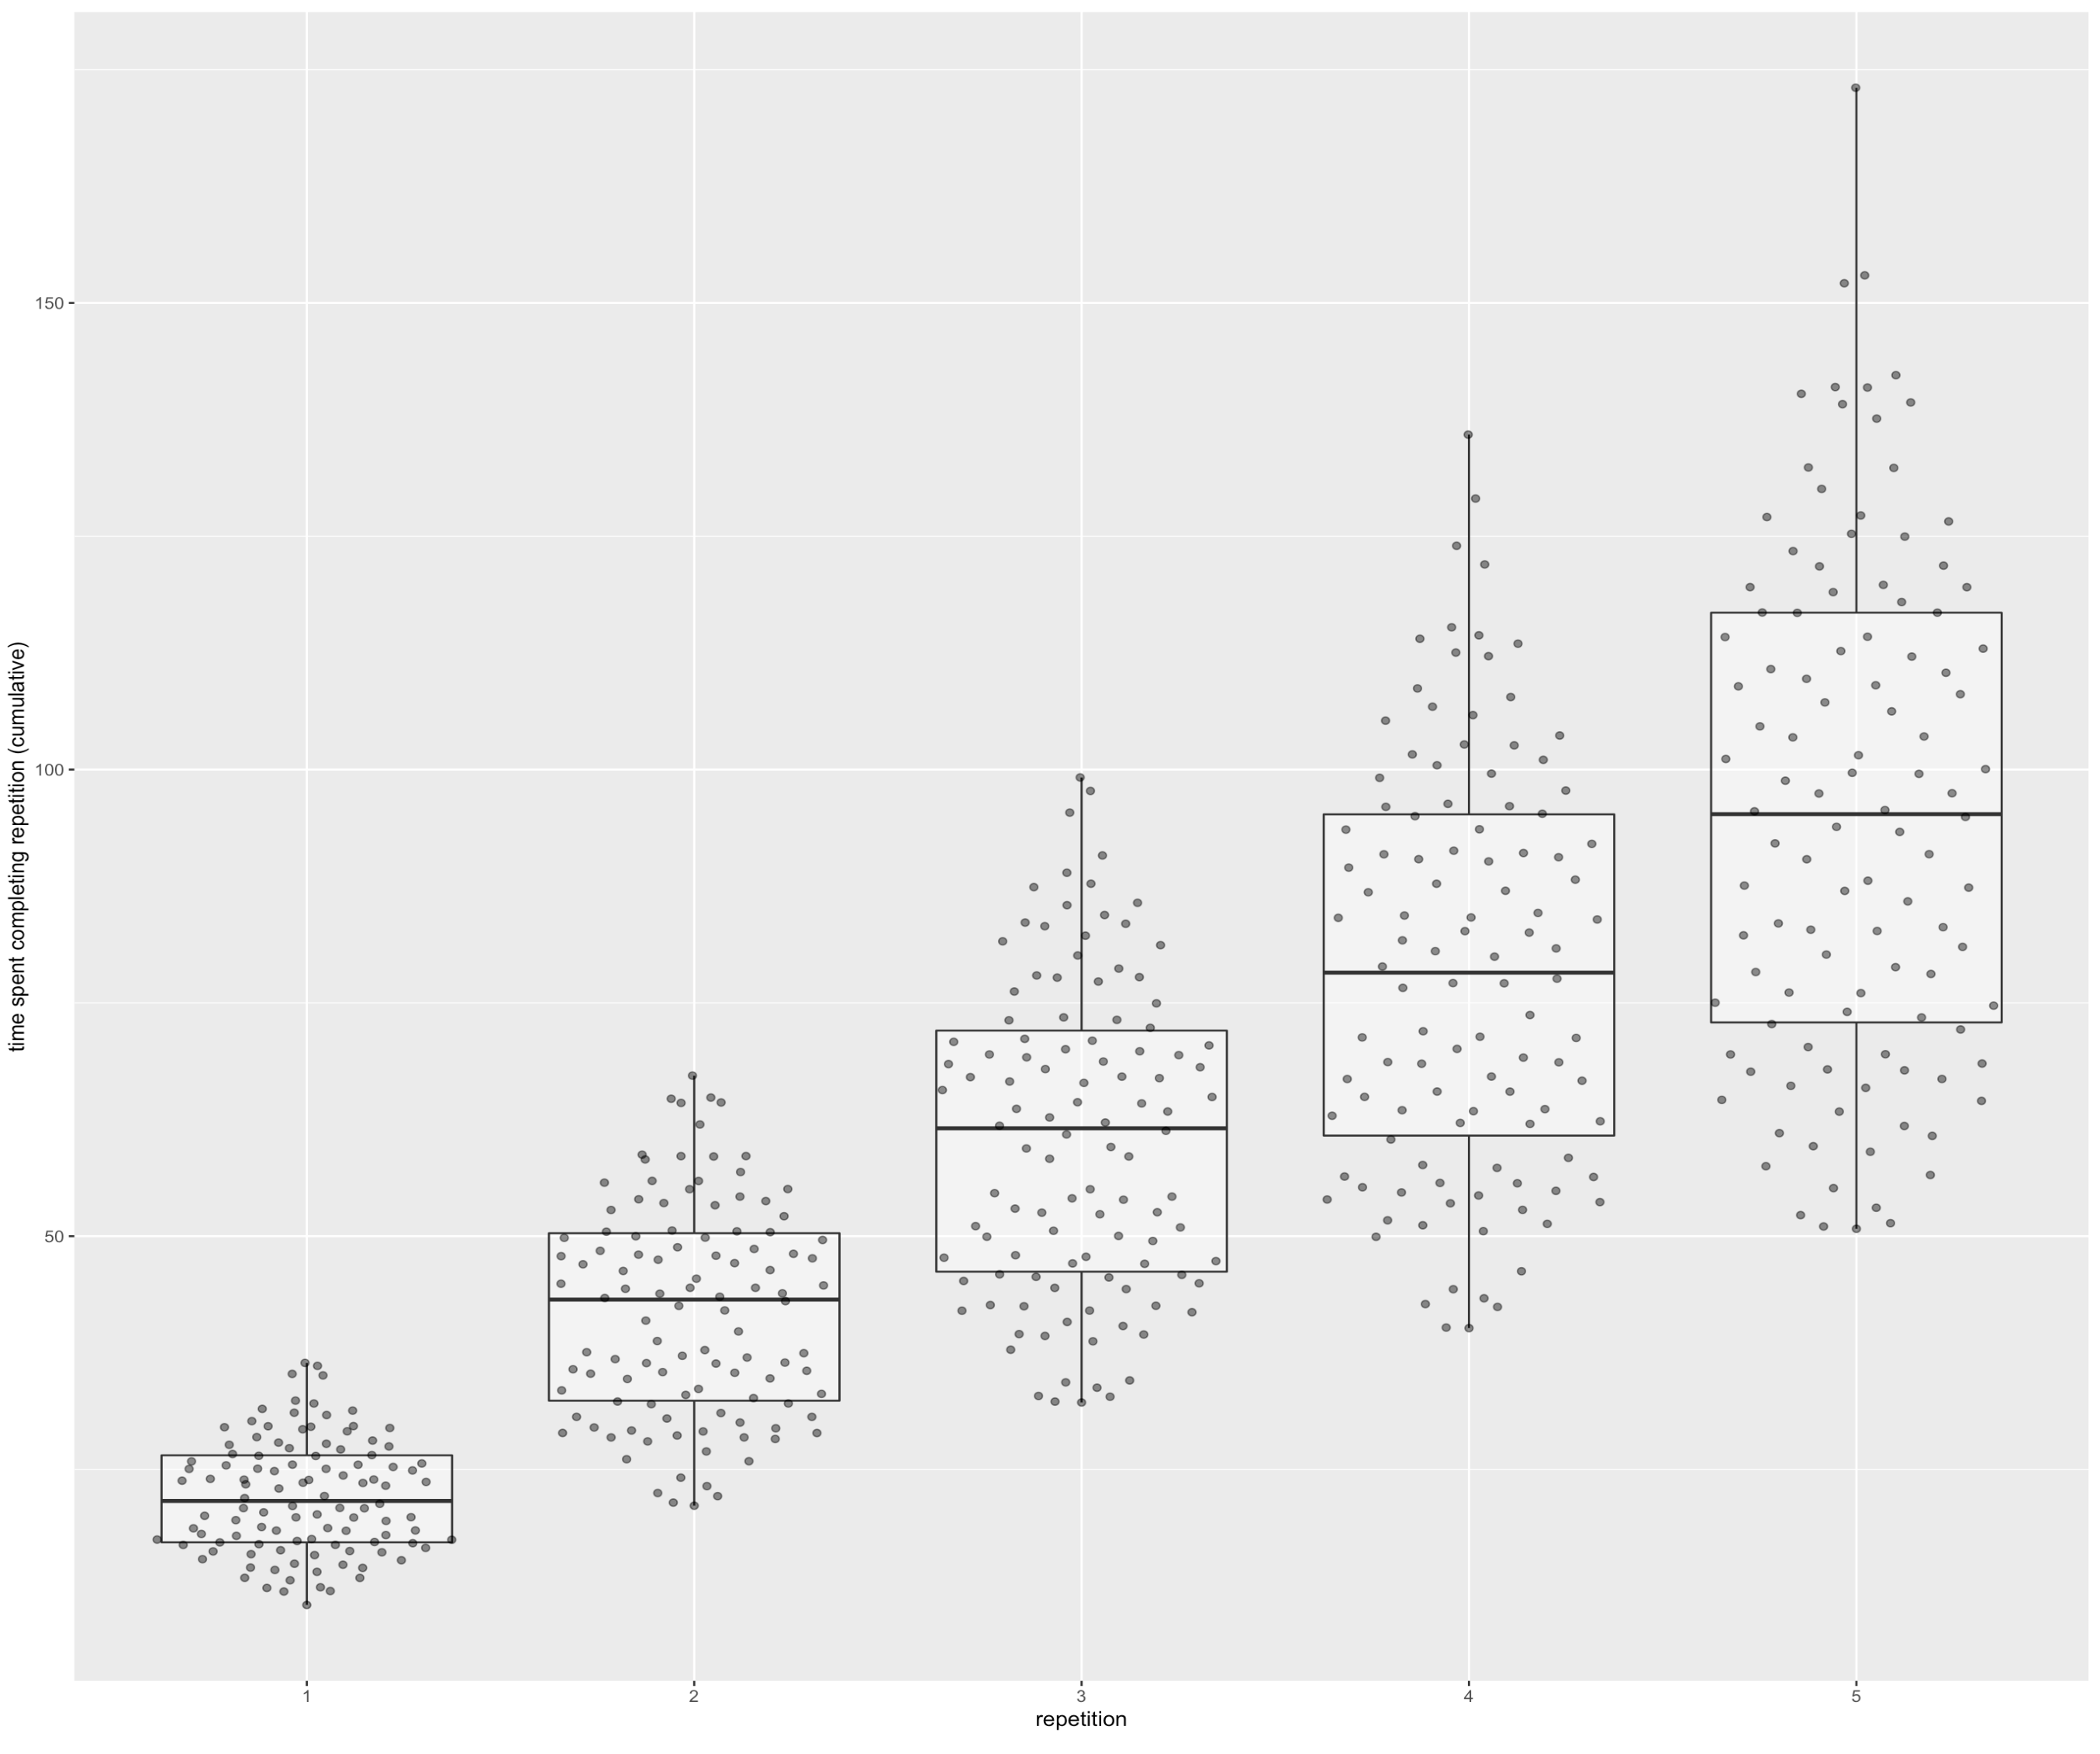
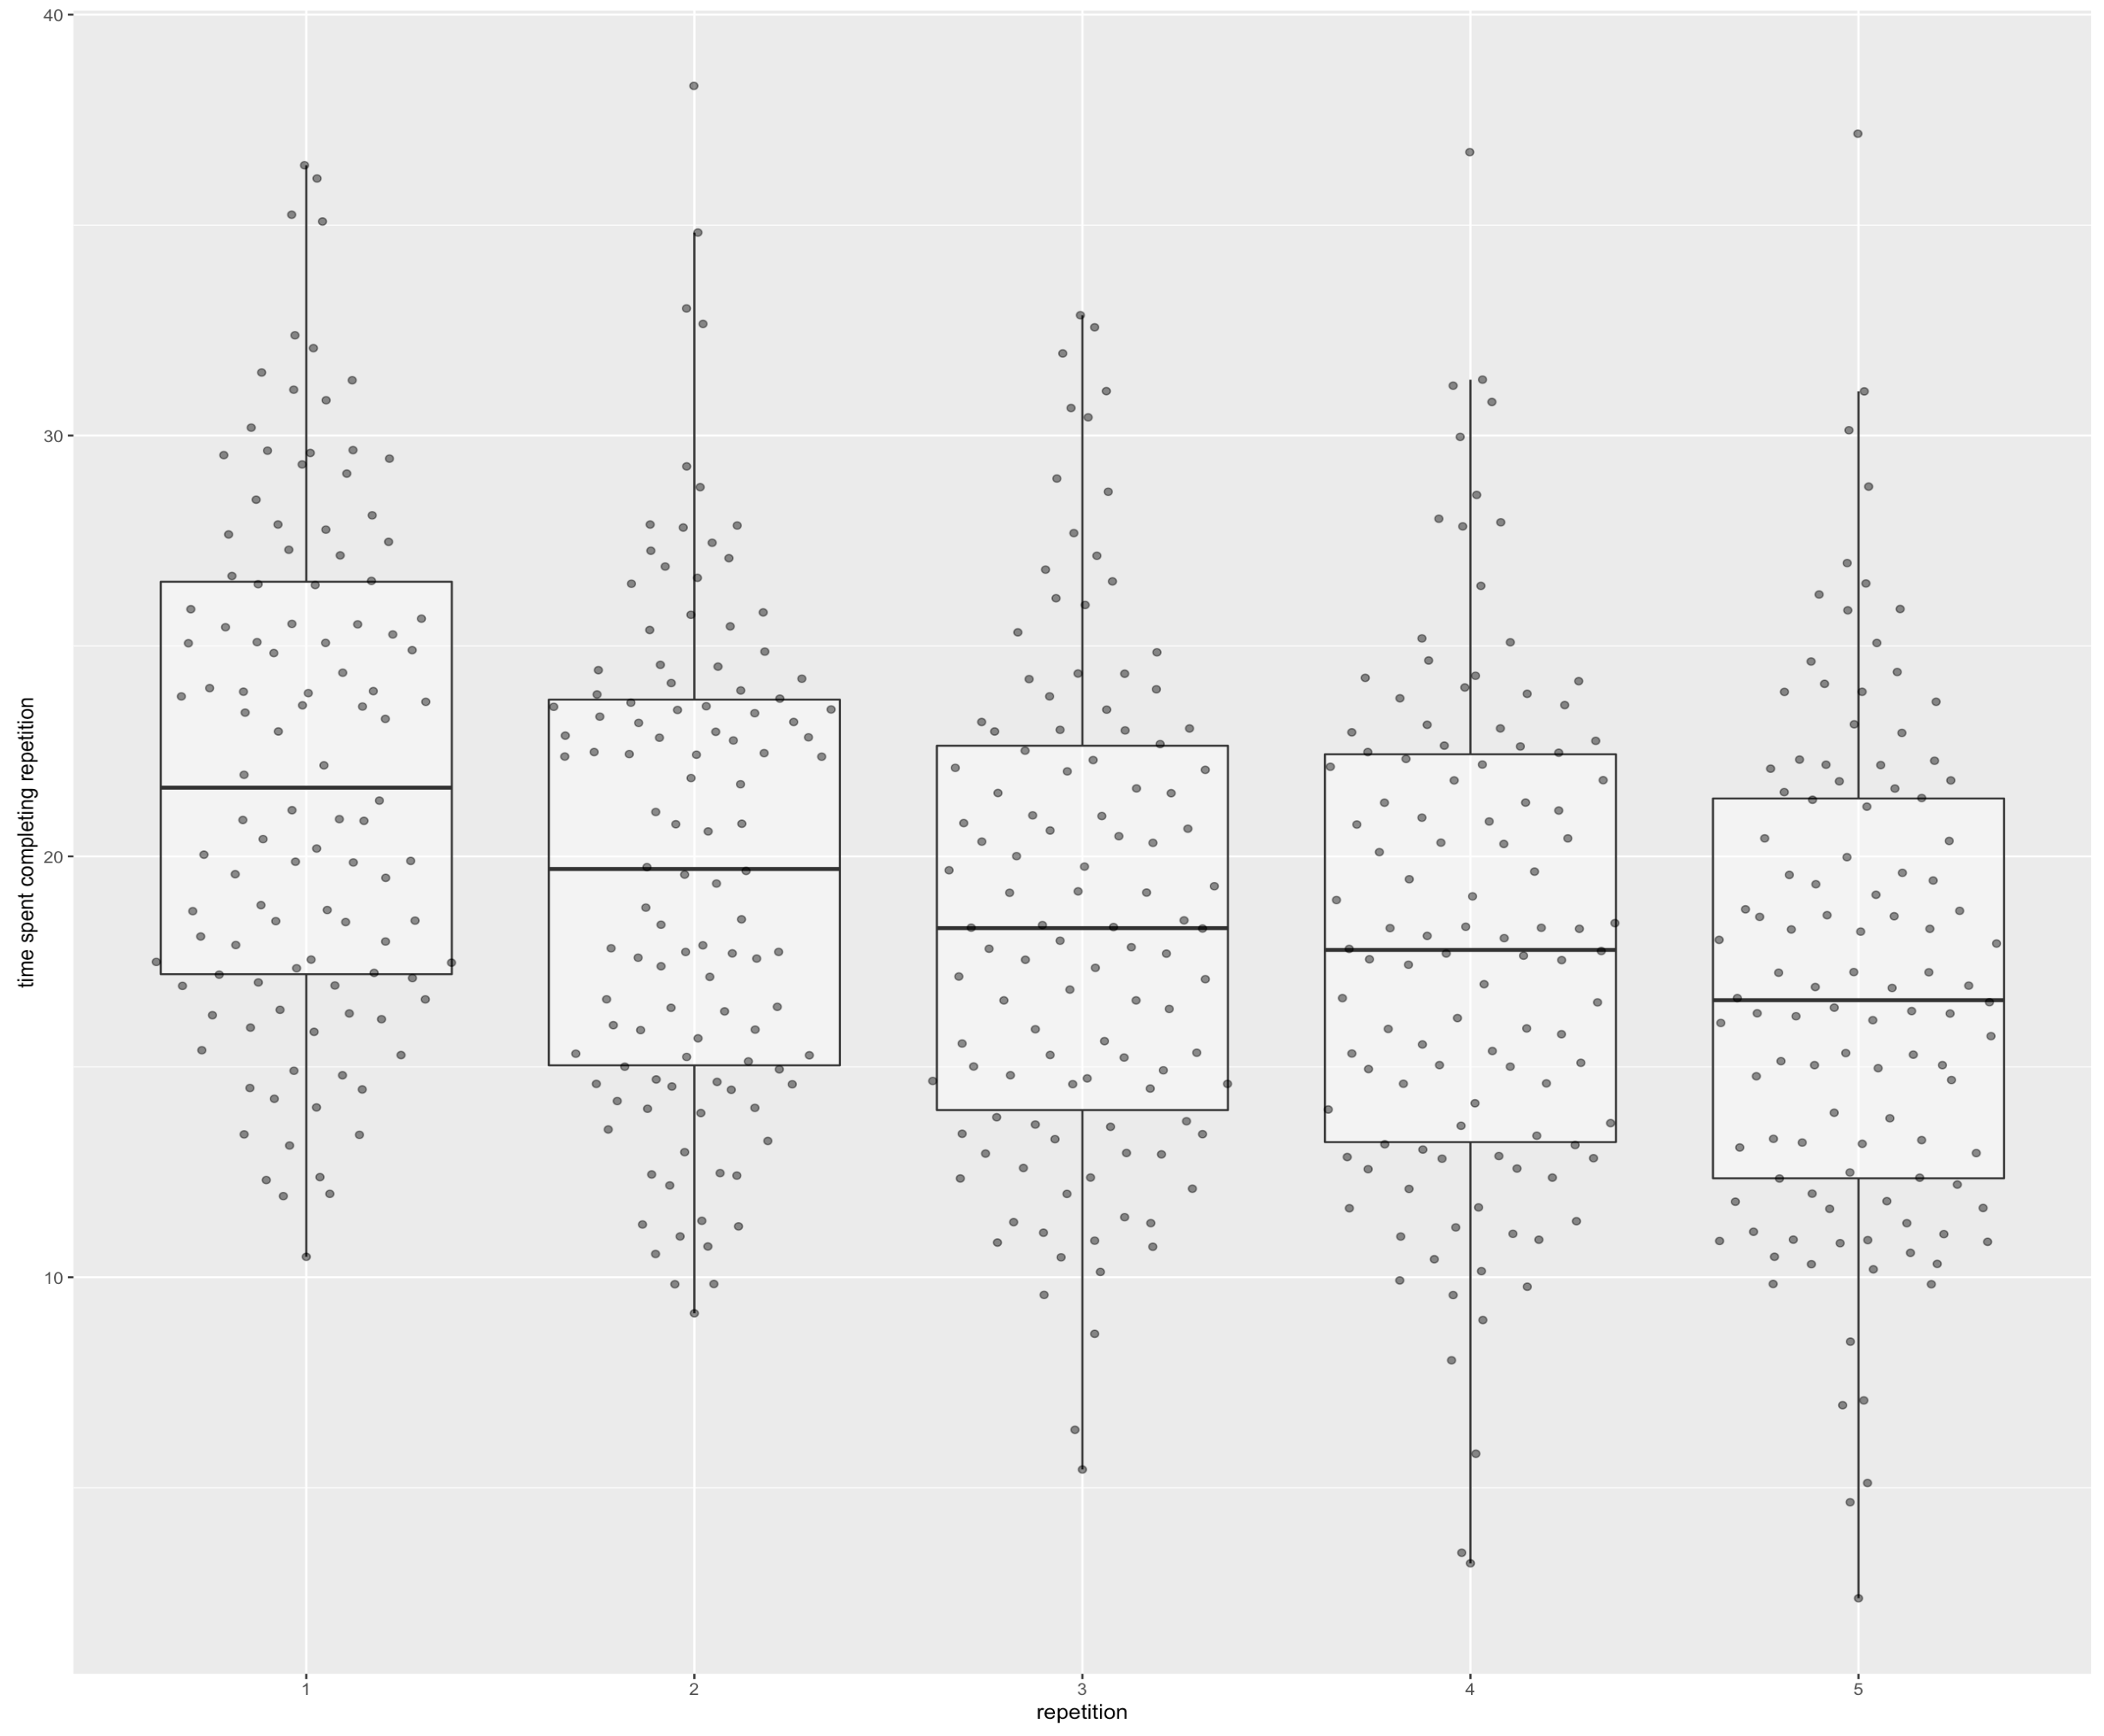
20220217132449
Those plots are cheating a little bit, since they only count the reviews that are actually part of a given repetition. I think that’s fair, since in practice if you just wanted to do four repetitions, you could e.g. elide all reps after that, and you’d get these numbers. But if you want “more fair” numbers: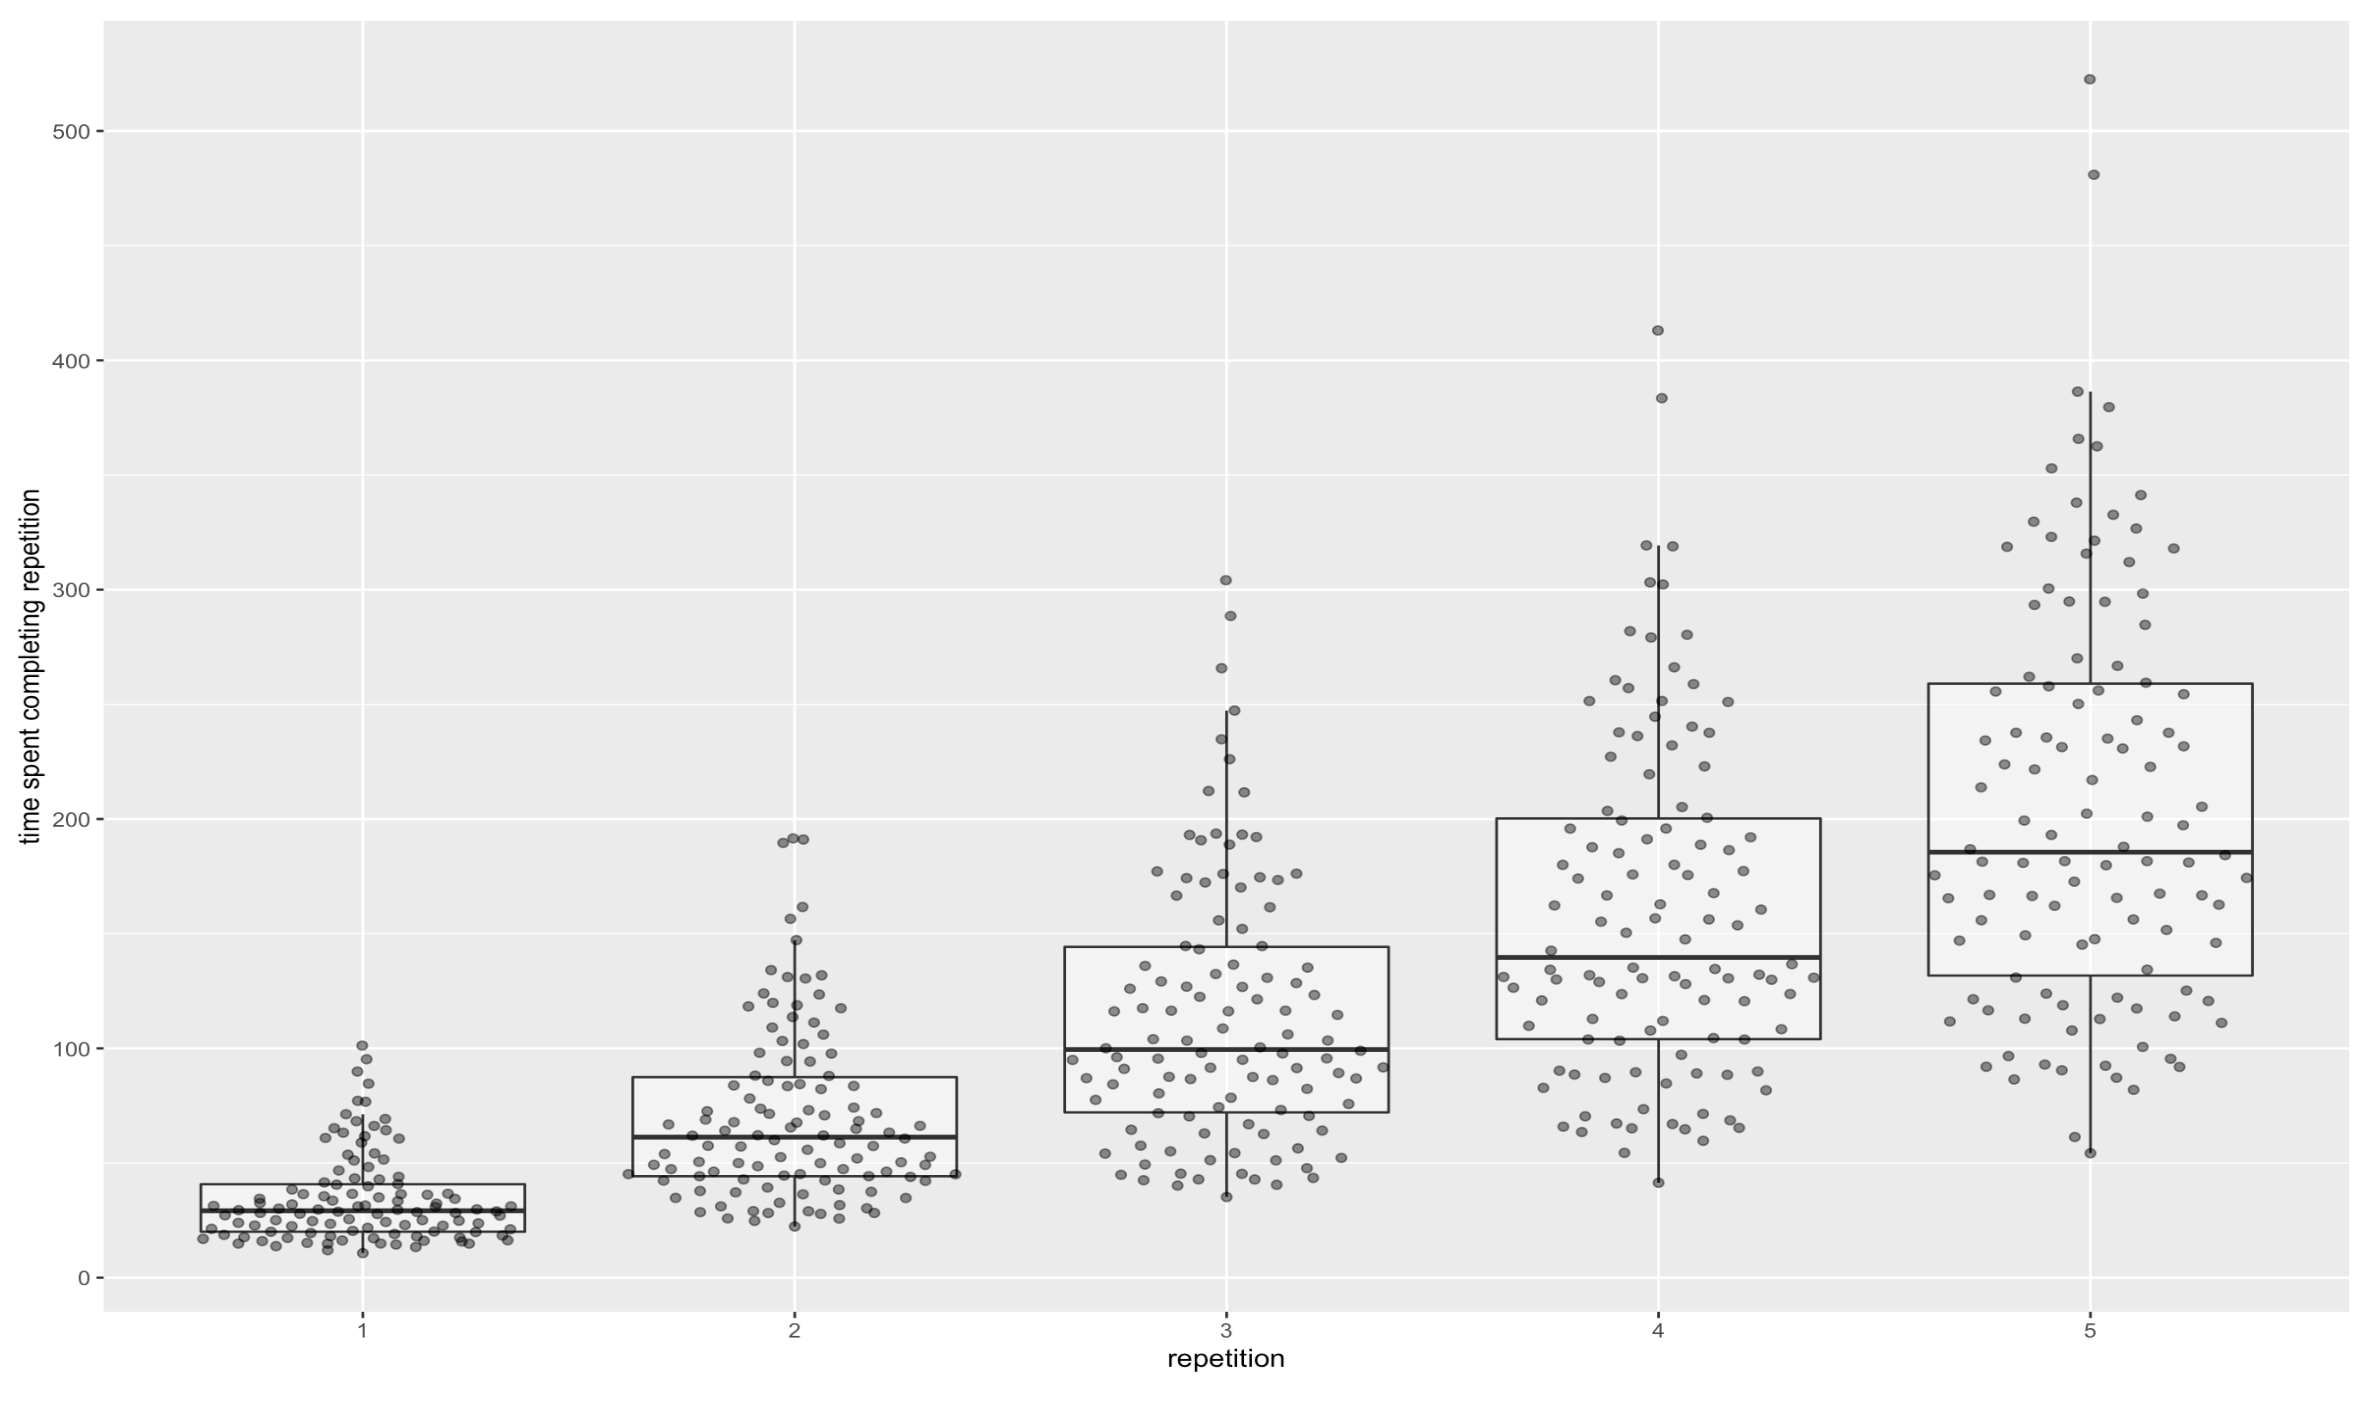
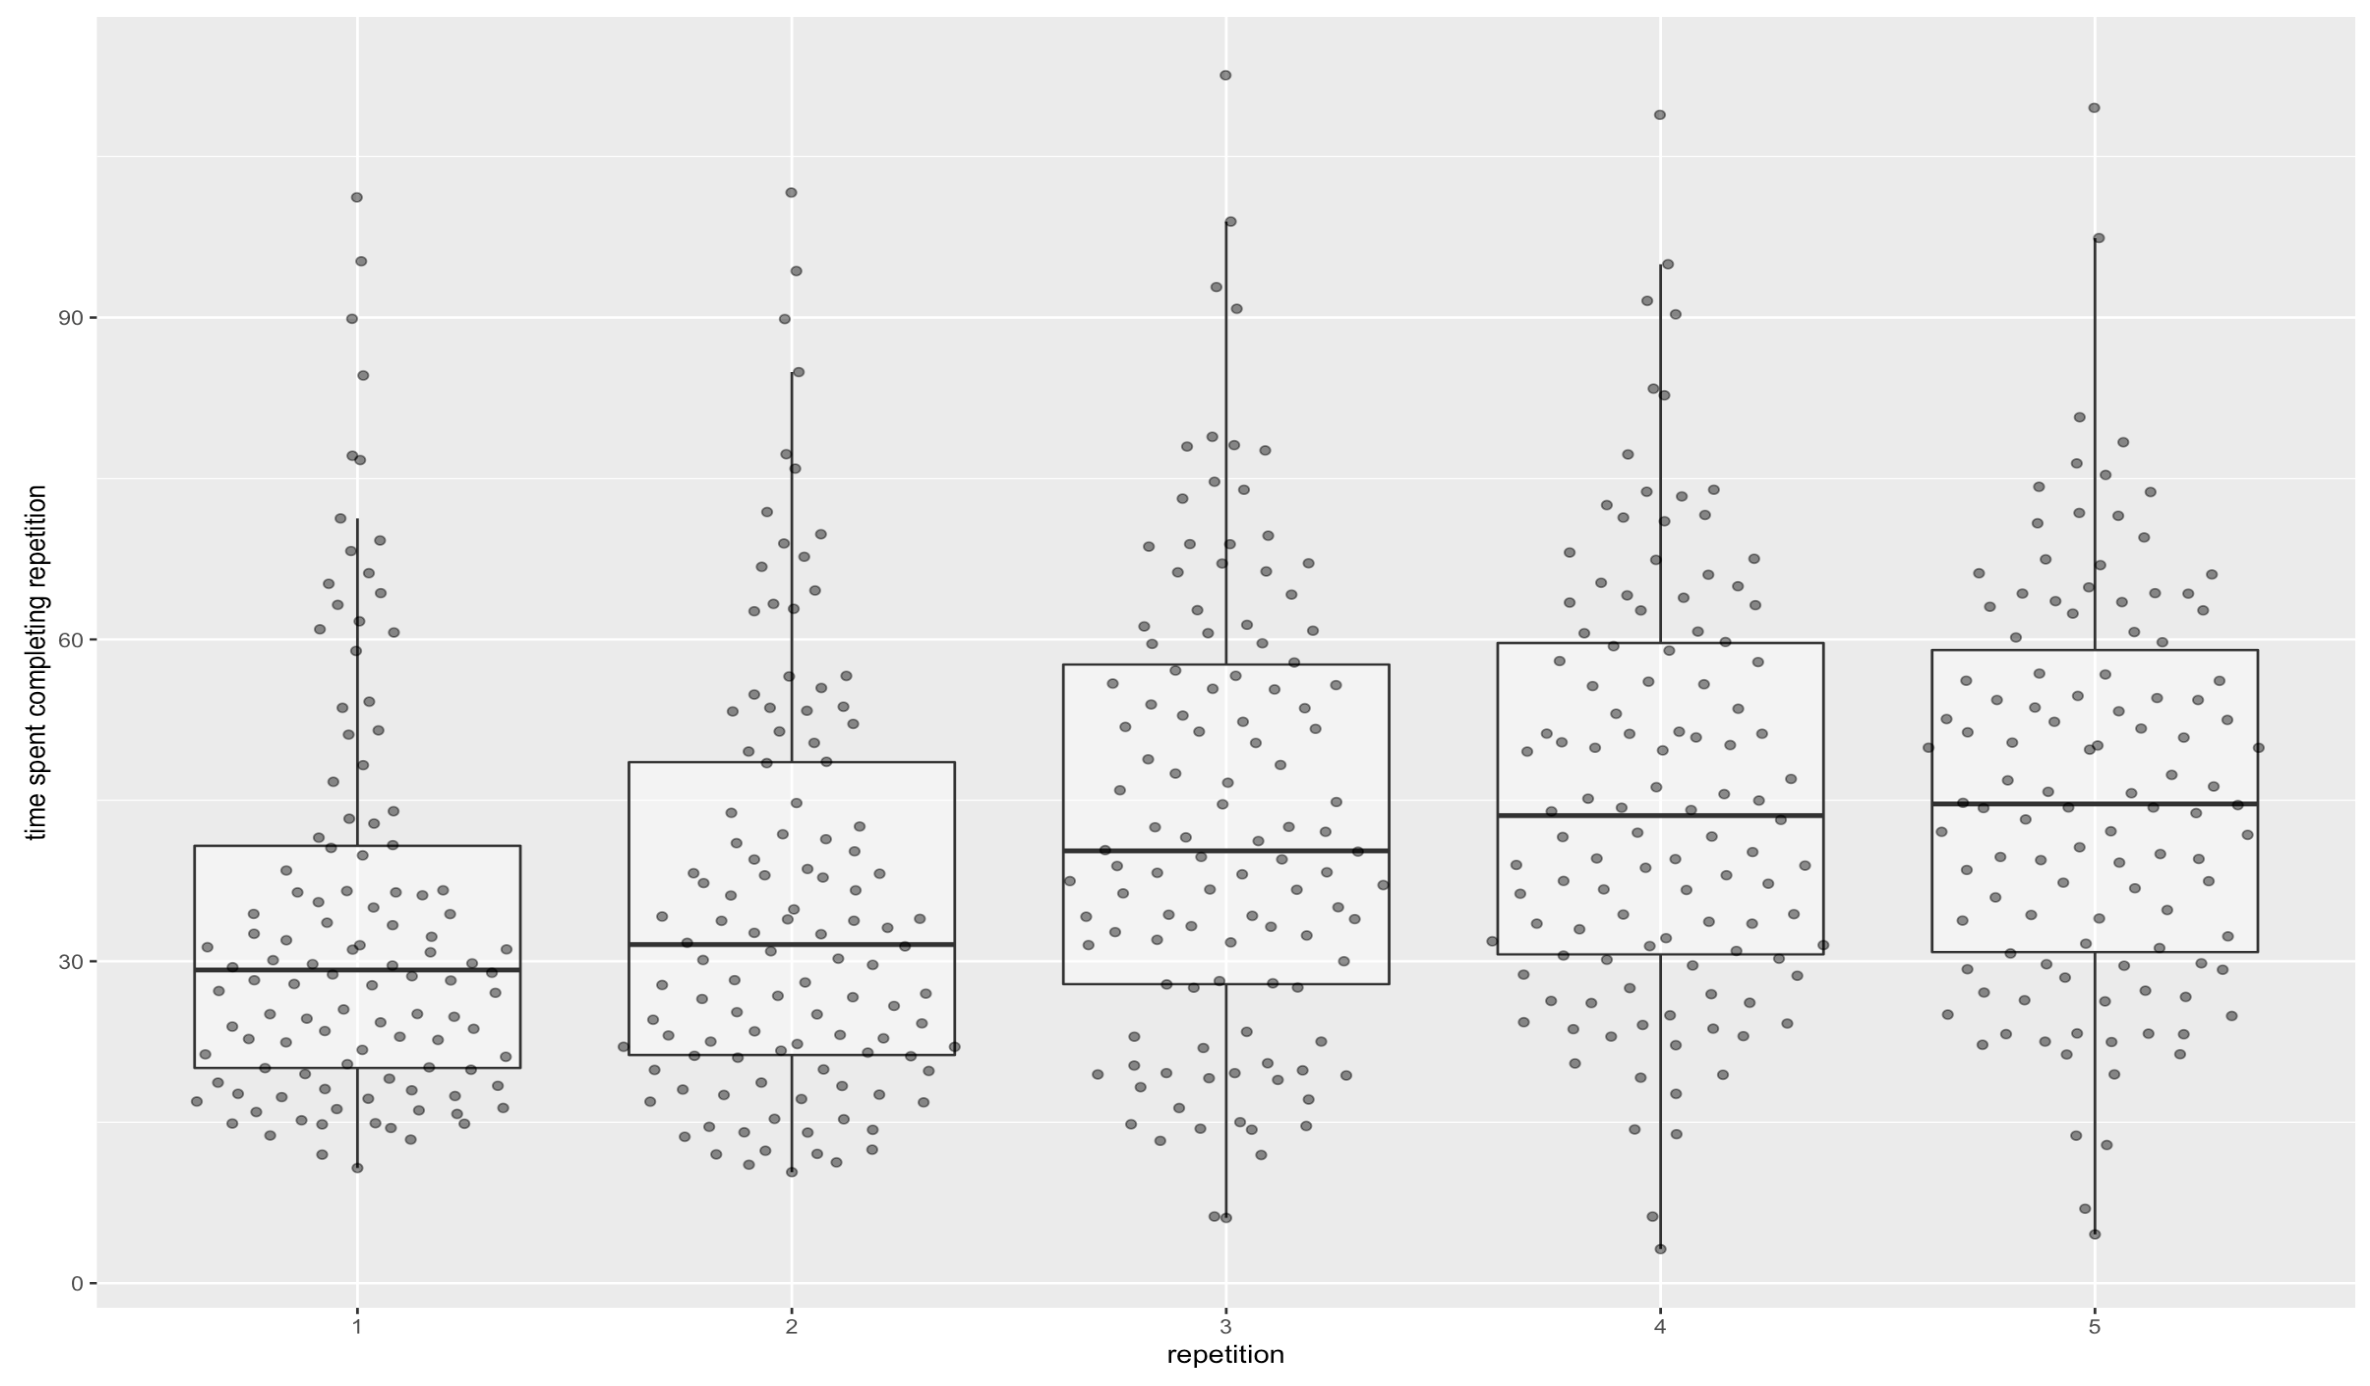
20220217132456
So, yes, to get the recall for 95% of the median user’s cards above 1 month, it takes about 80 minutes of review.
2022-02-16
Starting more closely at charts of demonstrated retention, one thing I’m surprised to notice is how many of the points are much higher than they “should” be. In early repetitions, this can be chalked up to tardiness, but that interval expands to a month or more in later repetitions. And it shouldn’t be cumulative—that is, early tardiness should get reset on each session.
Looking at QC’s sources, I realized with a start that I’m still running the 2020/10 per-answer variation in scheduling (for aggressiveStart and original users). I’ve been running it all this time! How much impact has that had? (Several hours go by in R…) Looks like not much, practically speaking. Around 5-10% of readers are getting “under scheduled”, which means e.g. we’re probably understating demonstrated retention at 1+ month.
Alright. I think I’ve got a decent summary presentation for “does it work”, and this sort of also works for showing the exponential (maybe with some clean-up).
Recall rates rise with each repetition, even while the intervals between repetitions get longer and longer.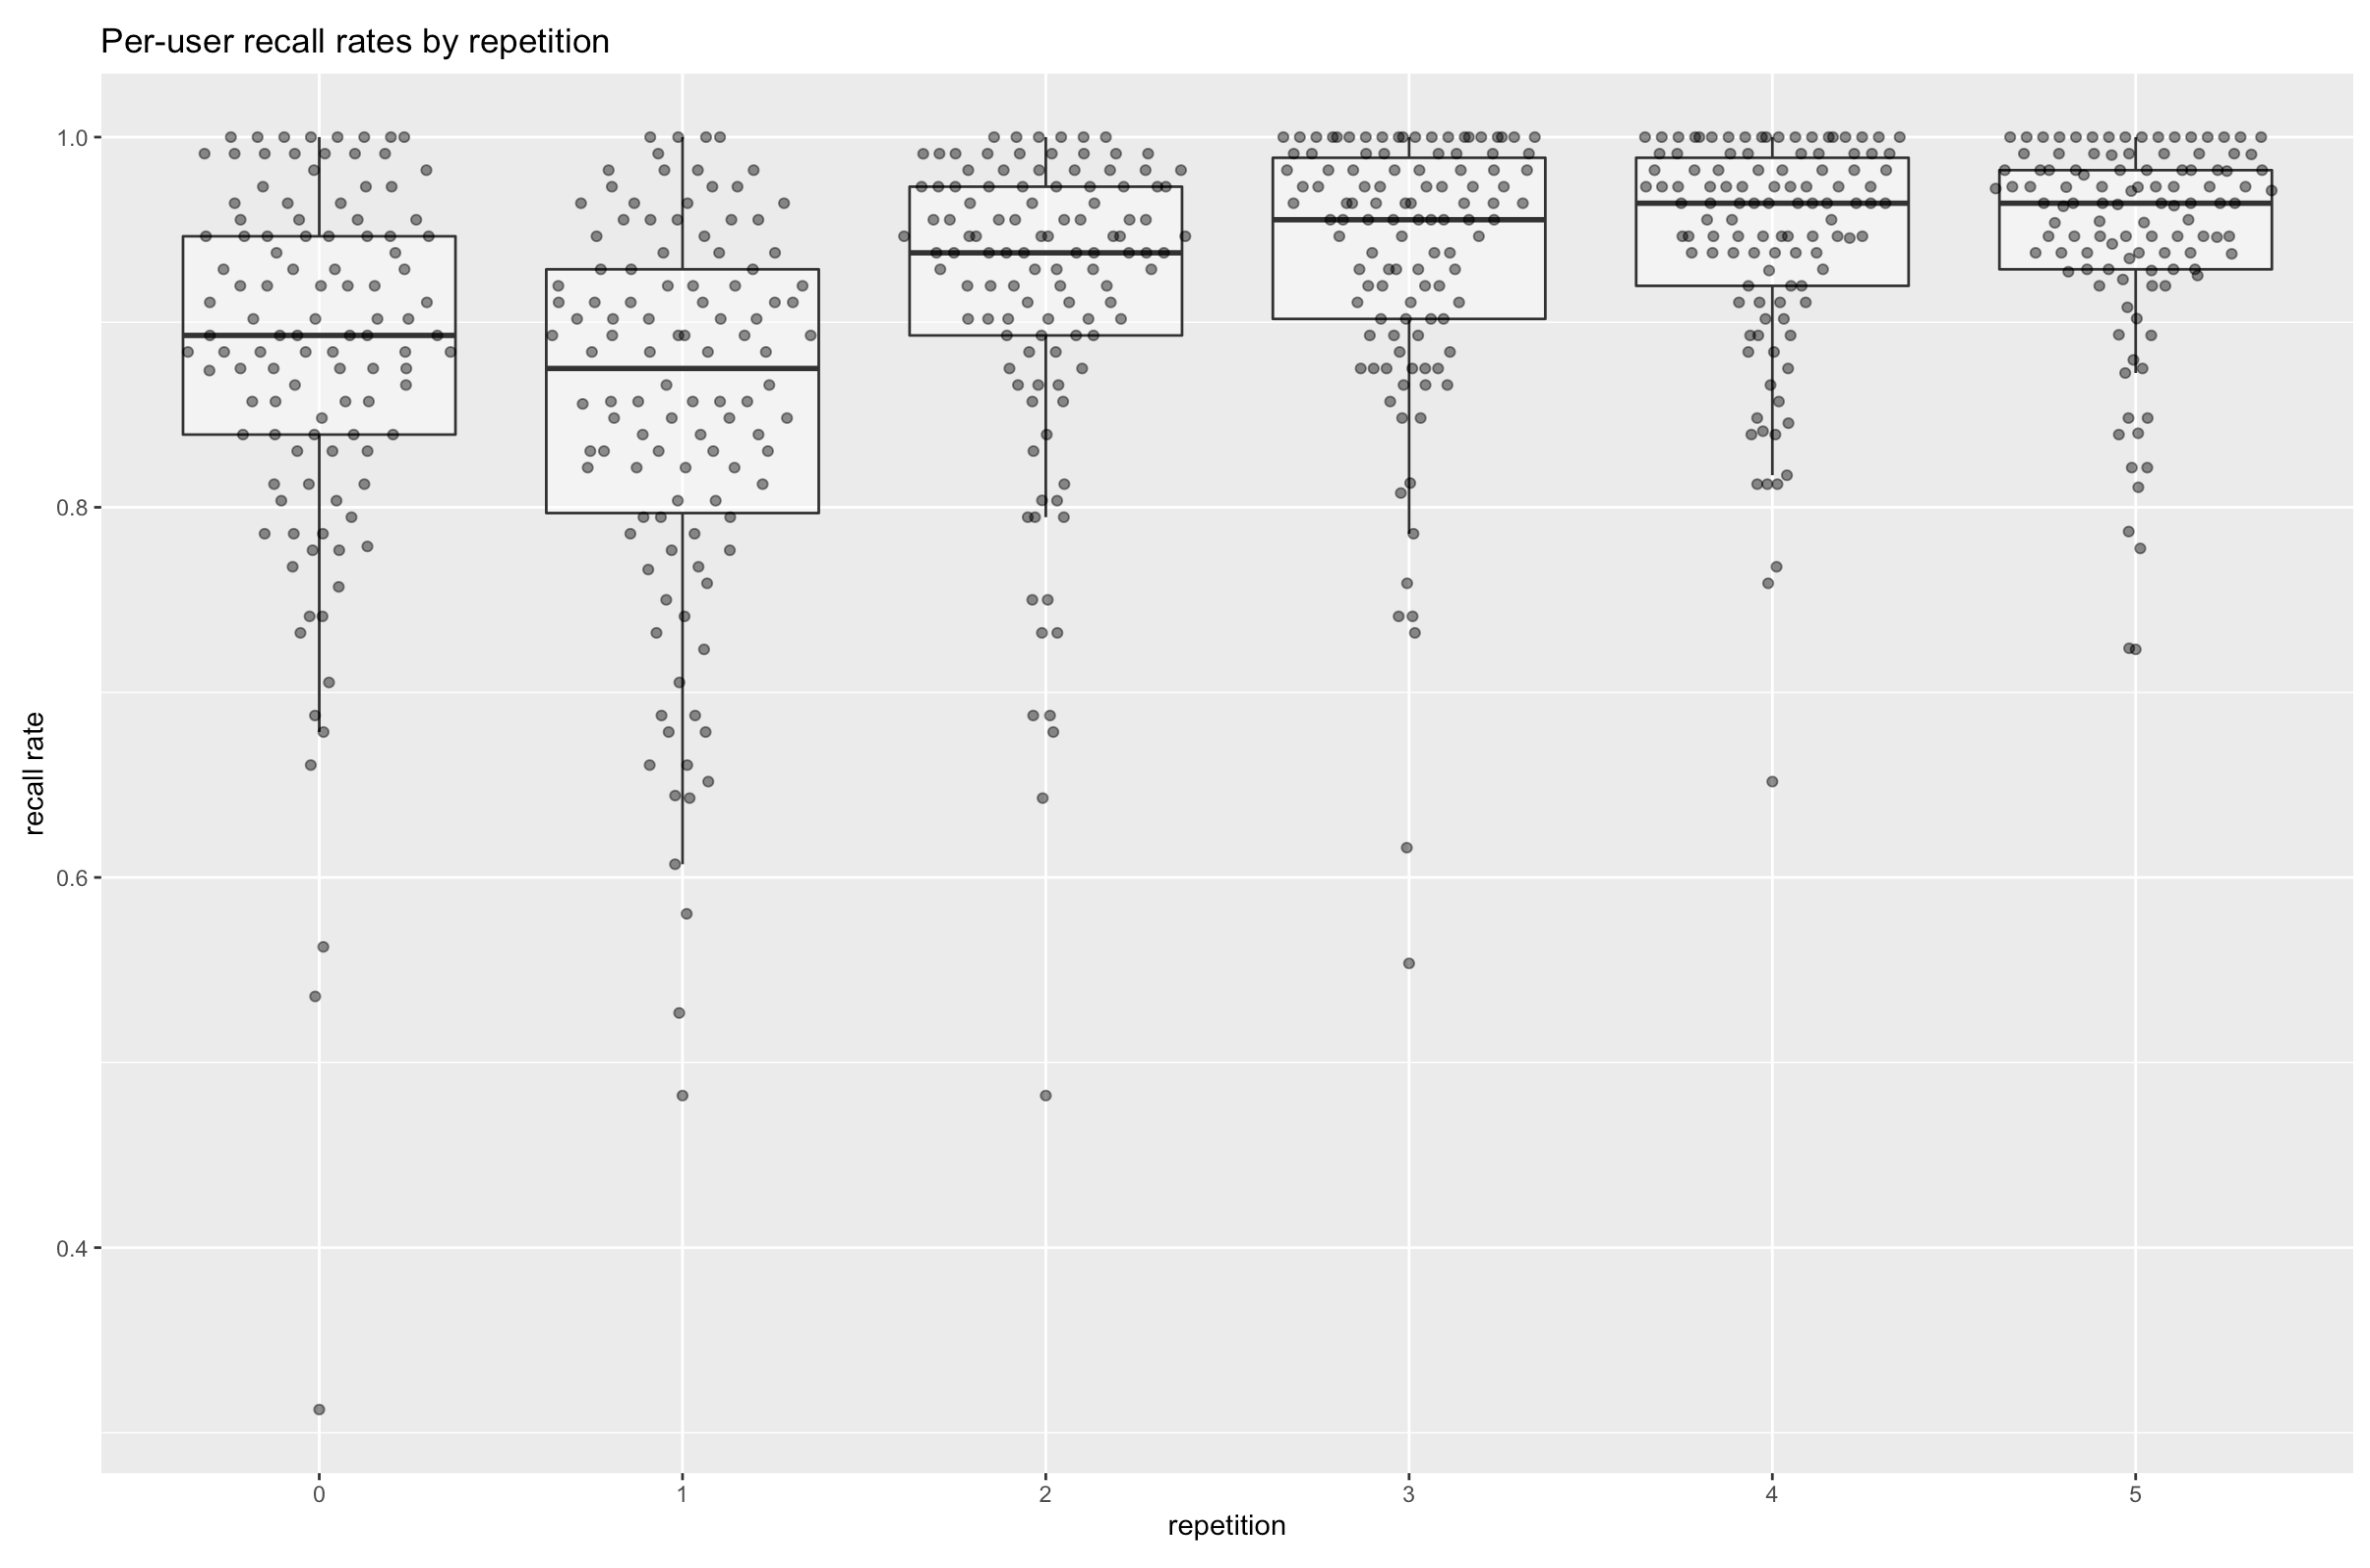
See 20220216132601 and 20220216132606 in qc-analysis.rmd.
The exponential is still there, buried in the noise of the latter plot.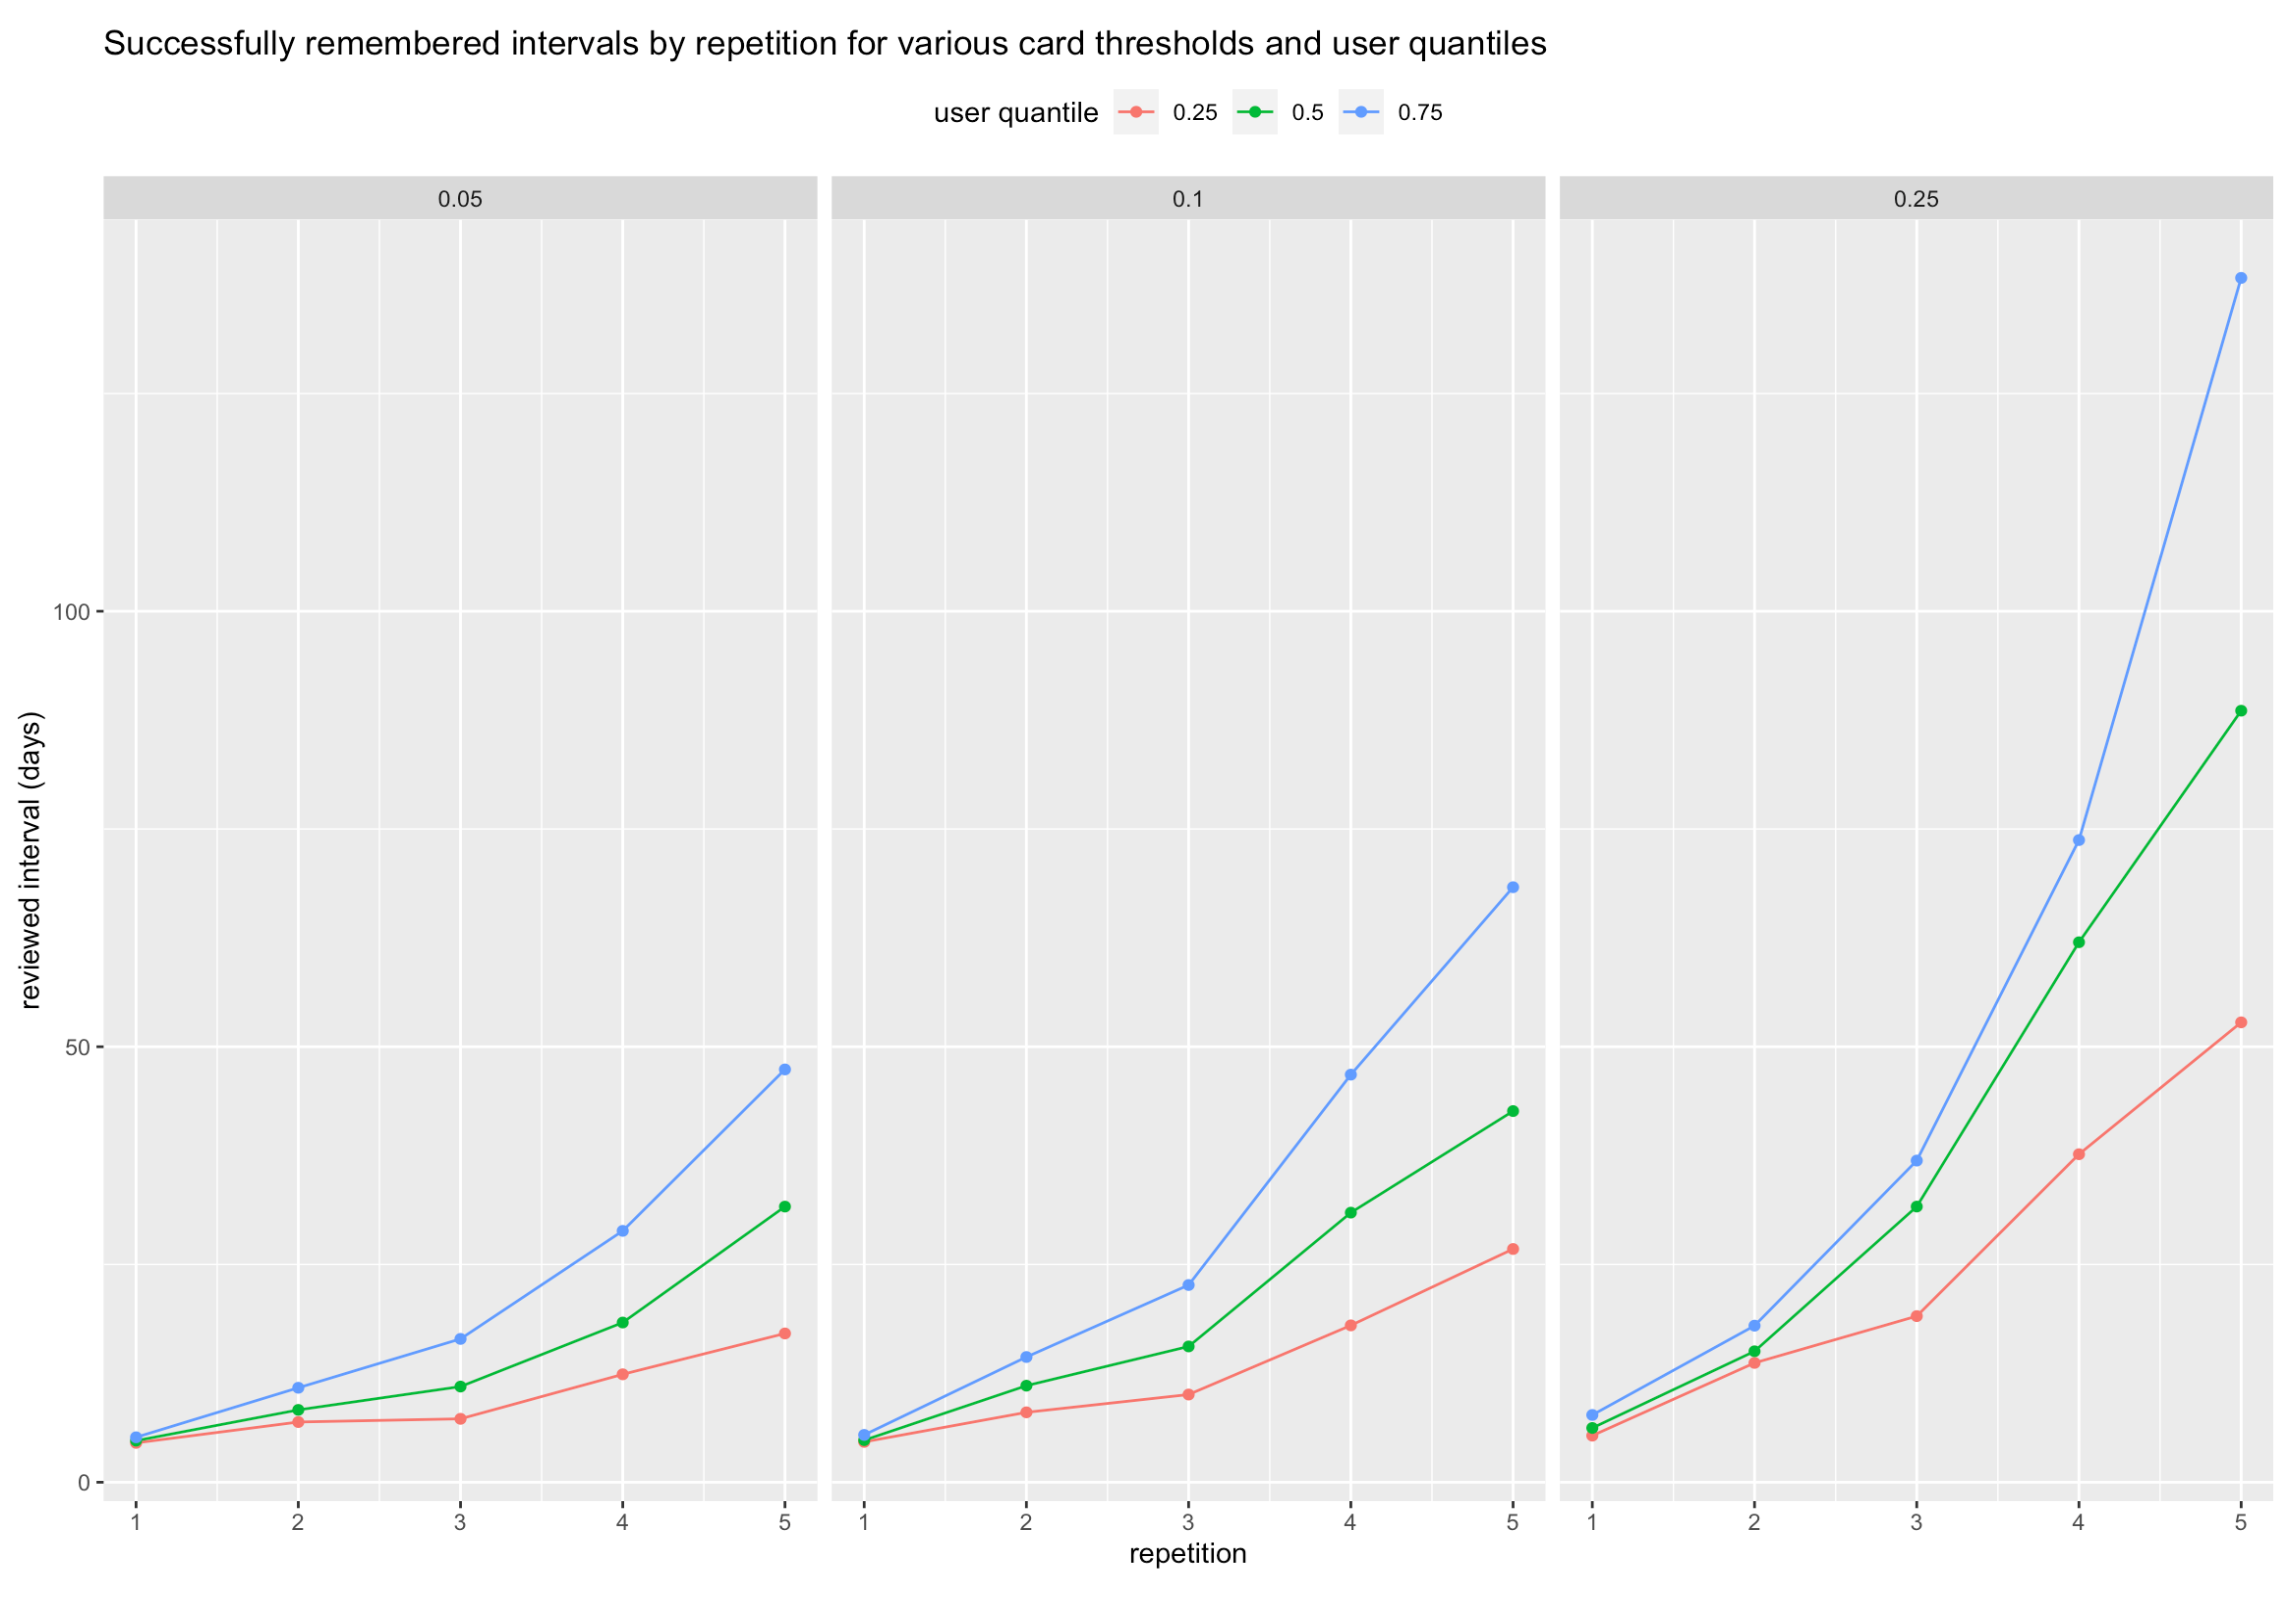
20220216133411
And the per-card recall rates look good, too. By repetition 3, only 5-8 have recall rates below 80%.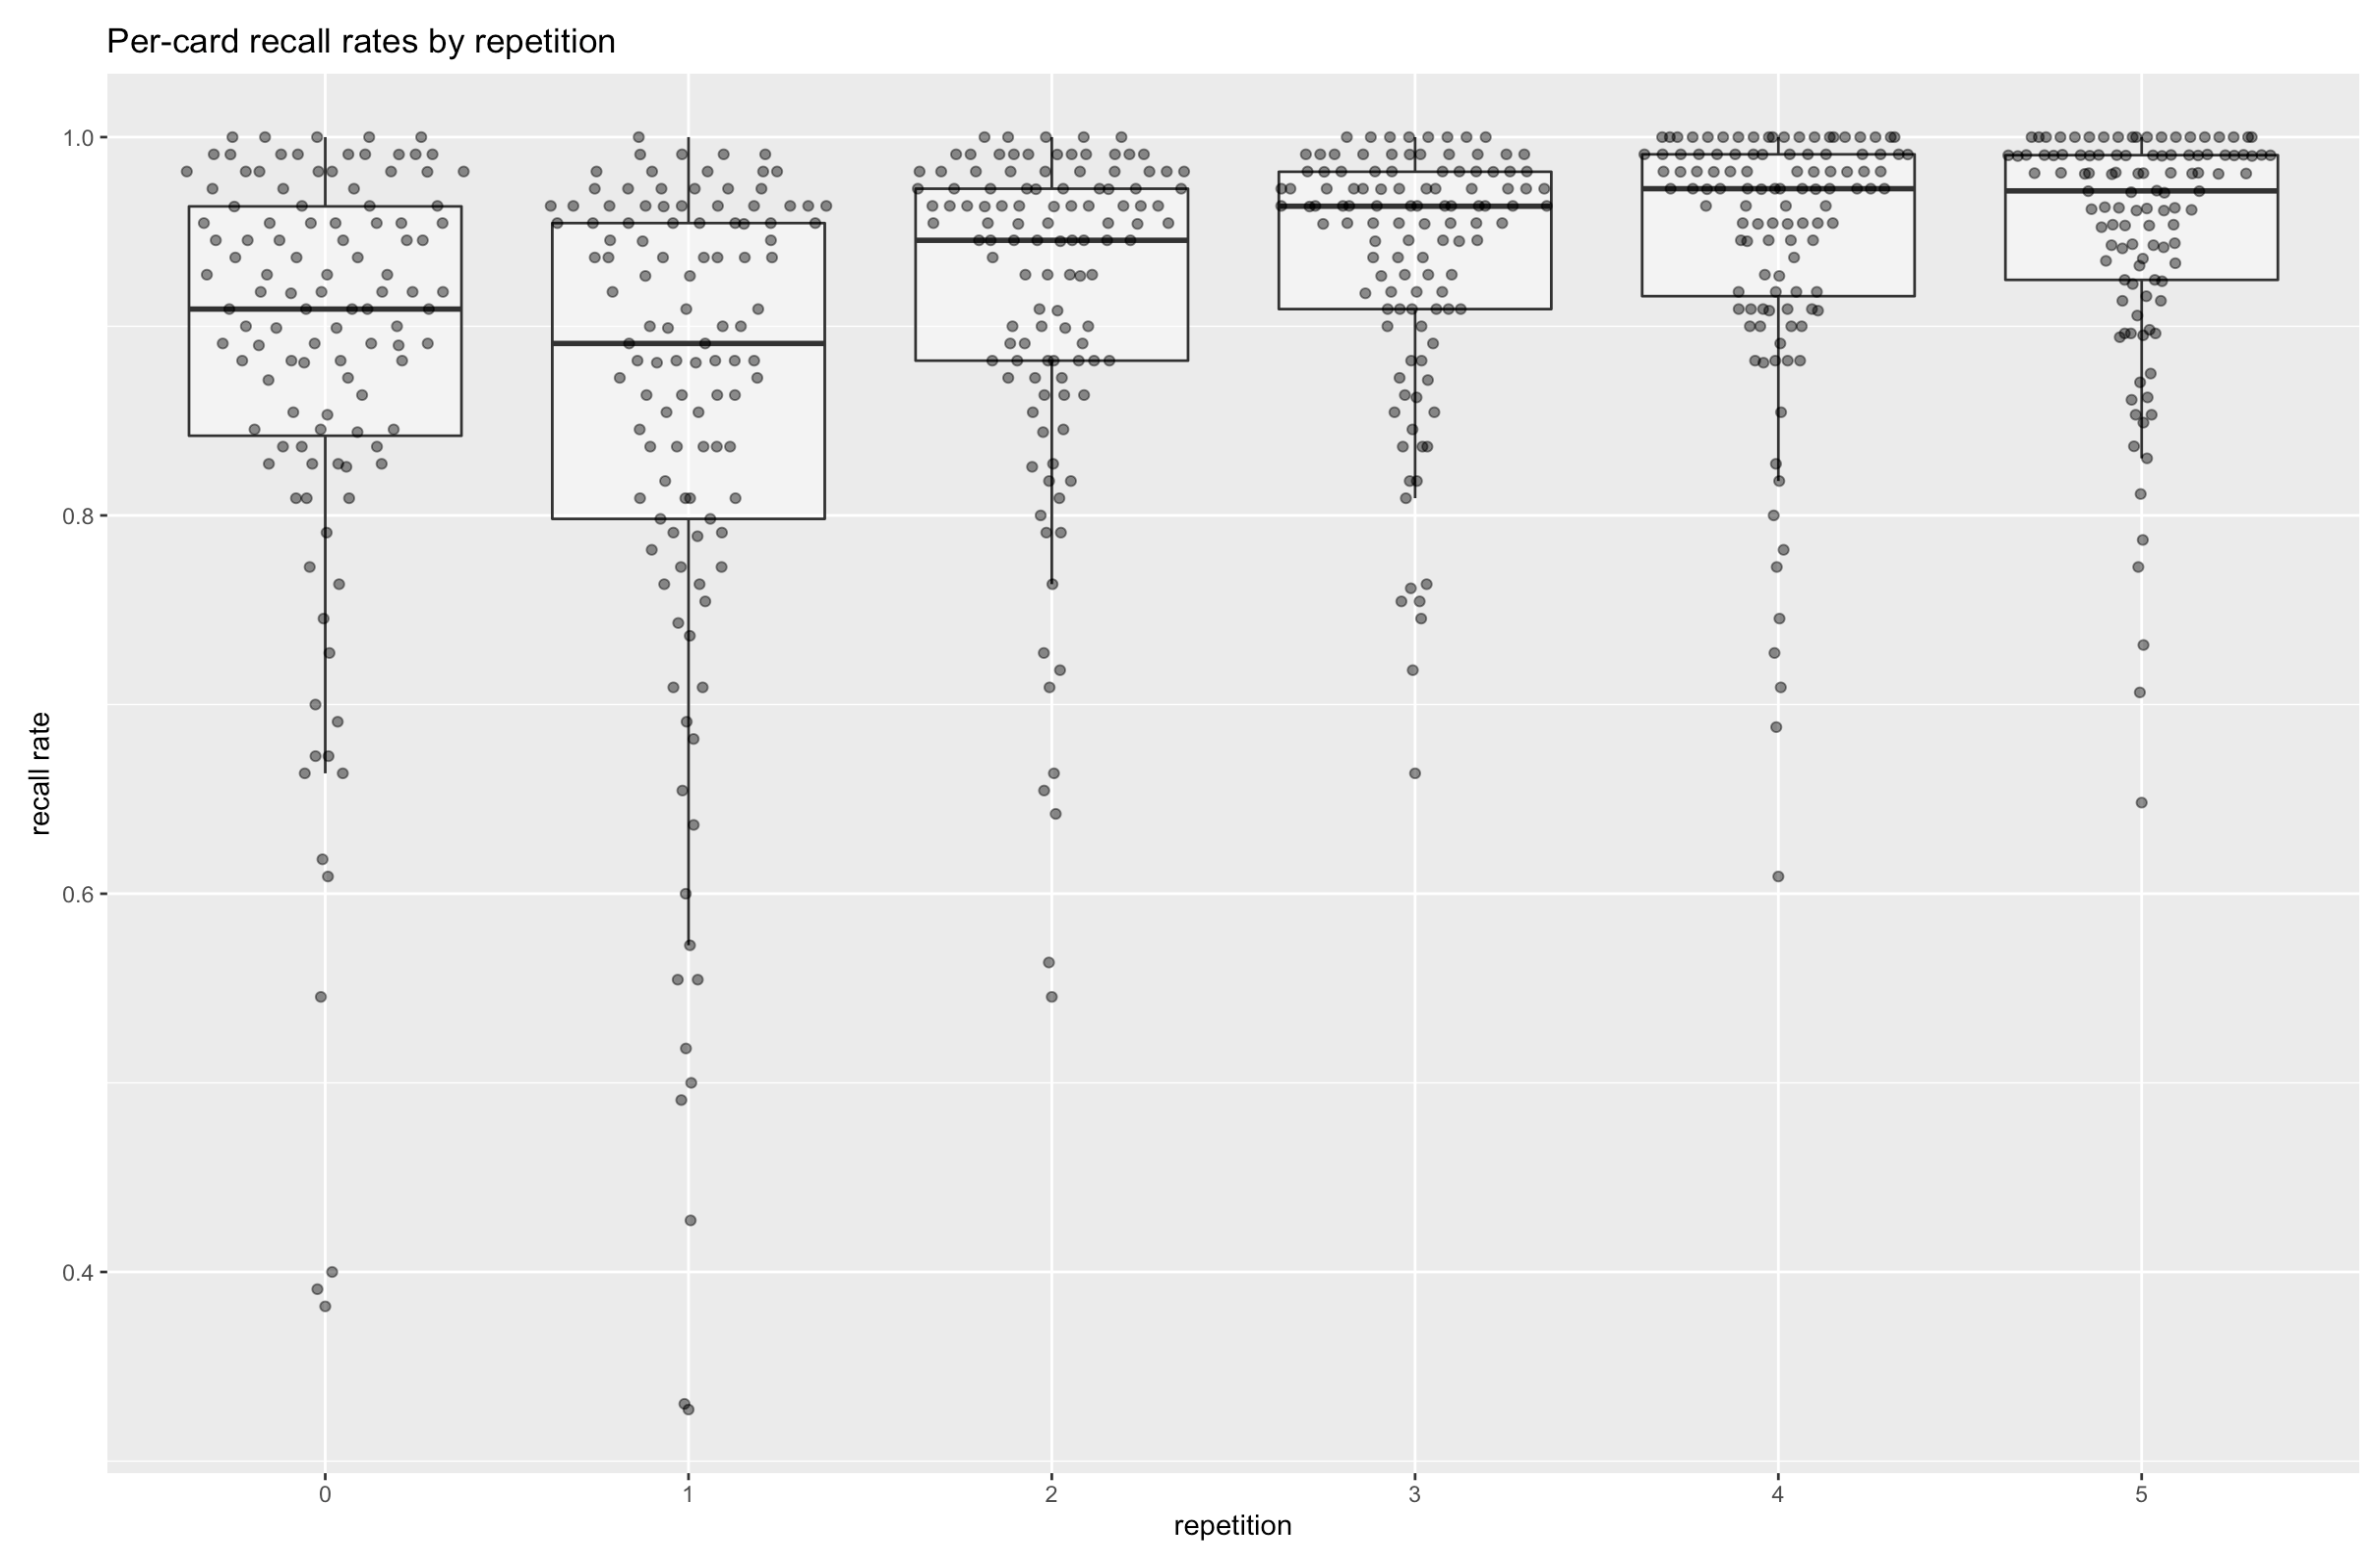
20220216133522
2022-02-14 / 2022-02-15
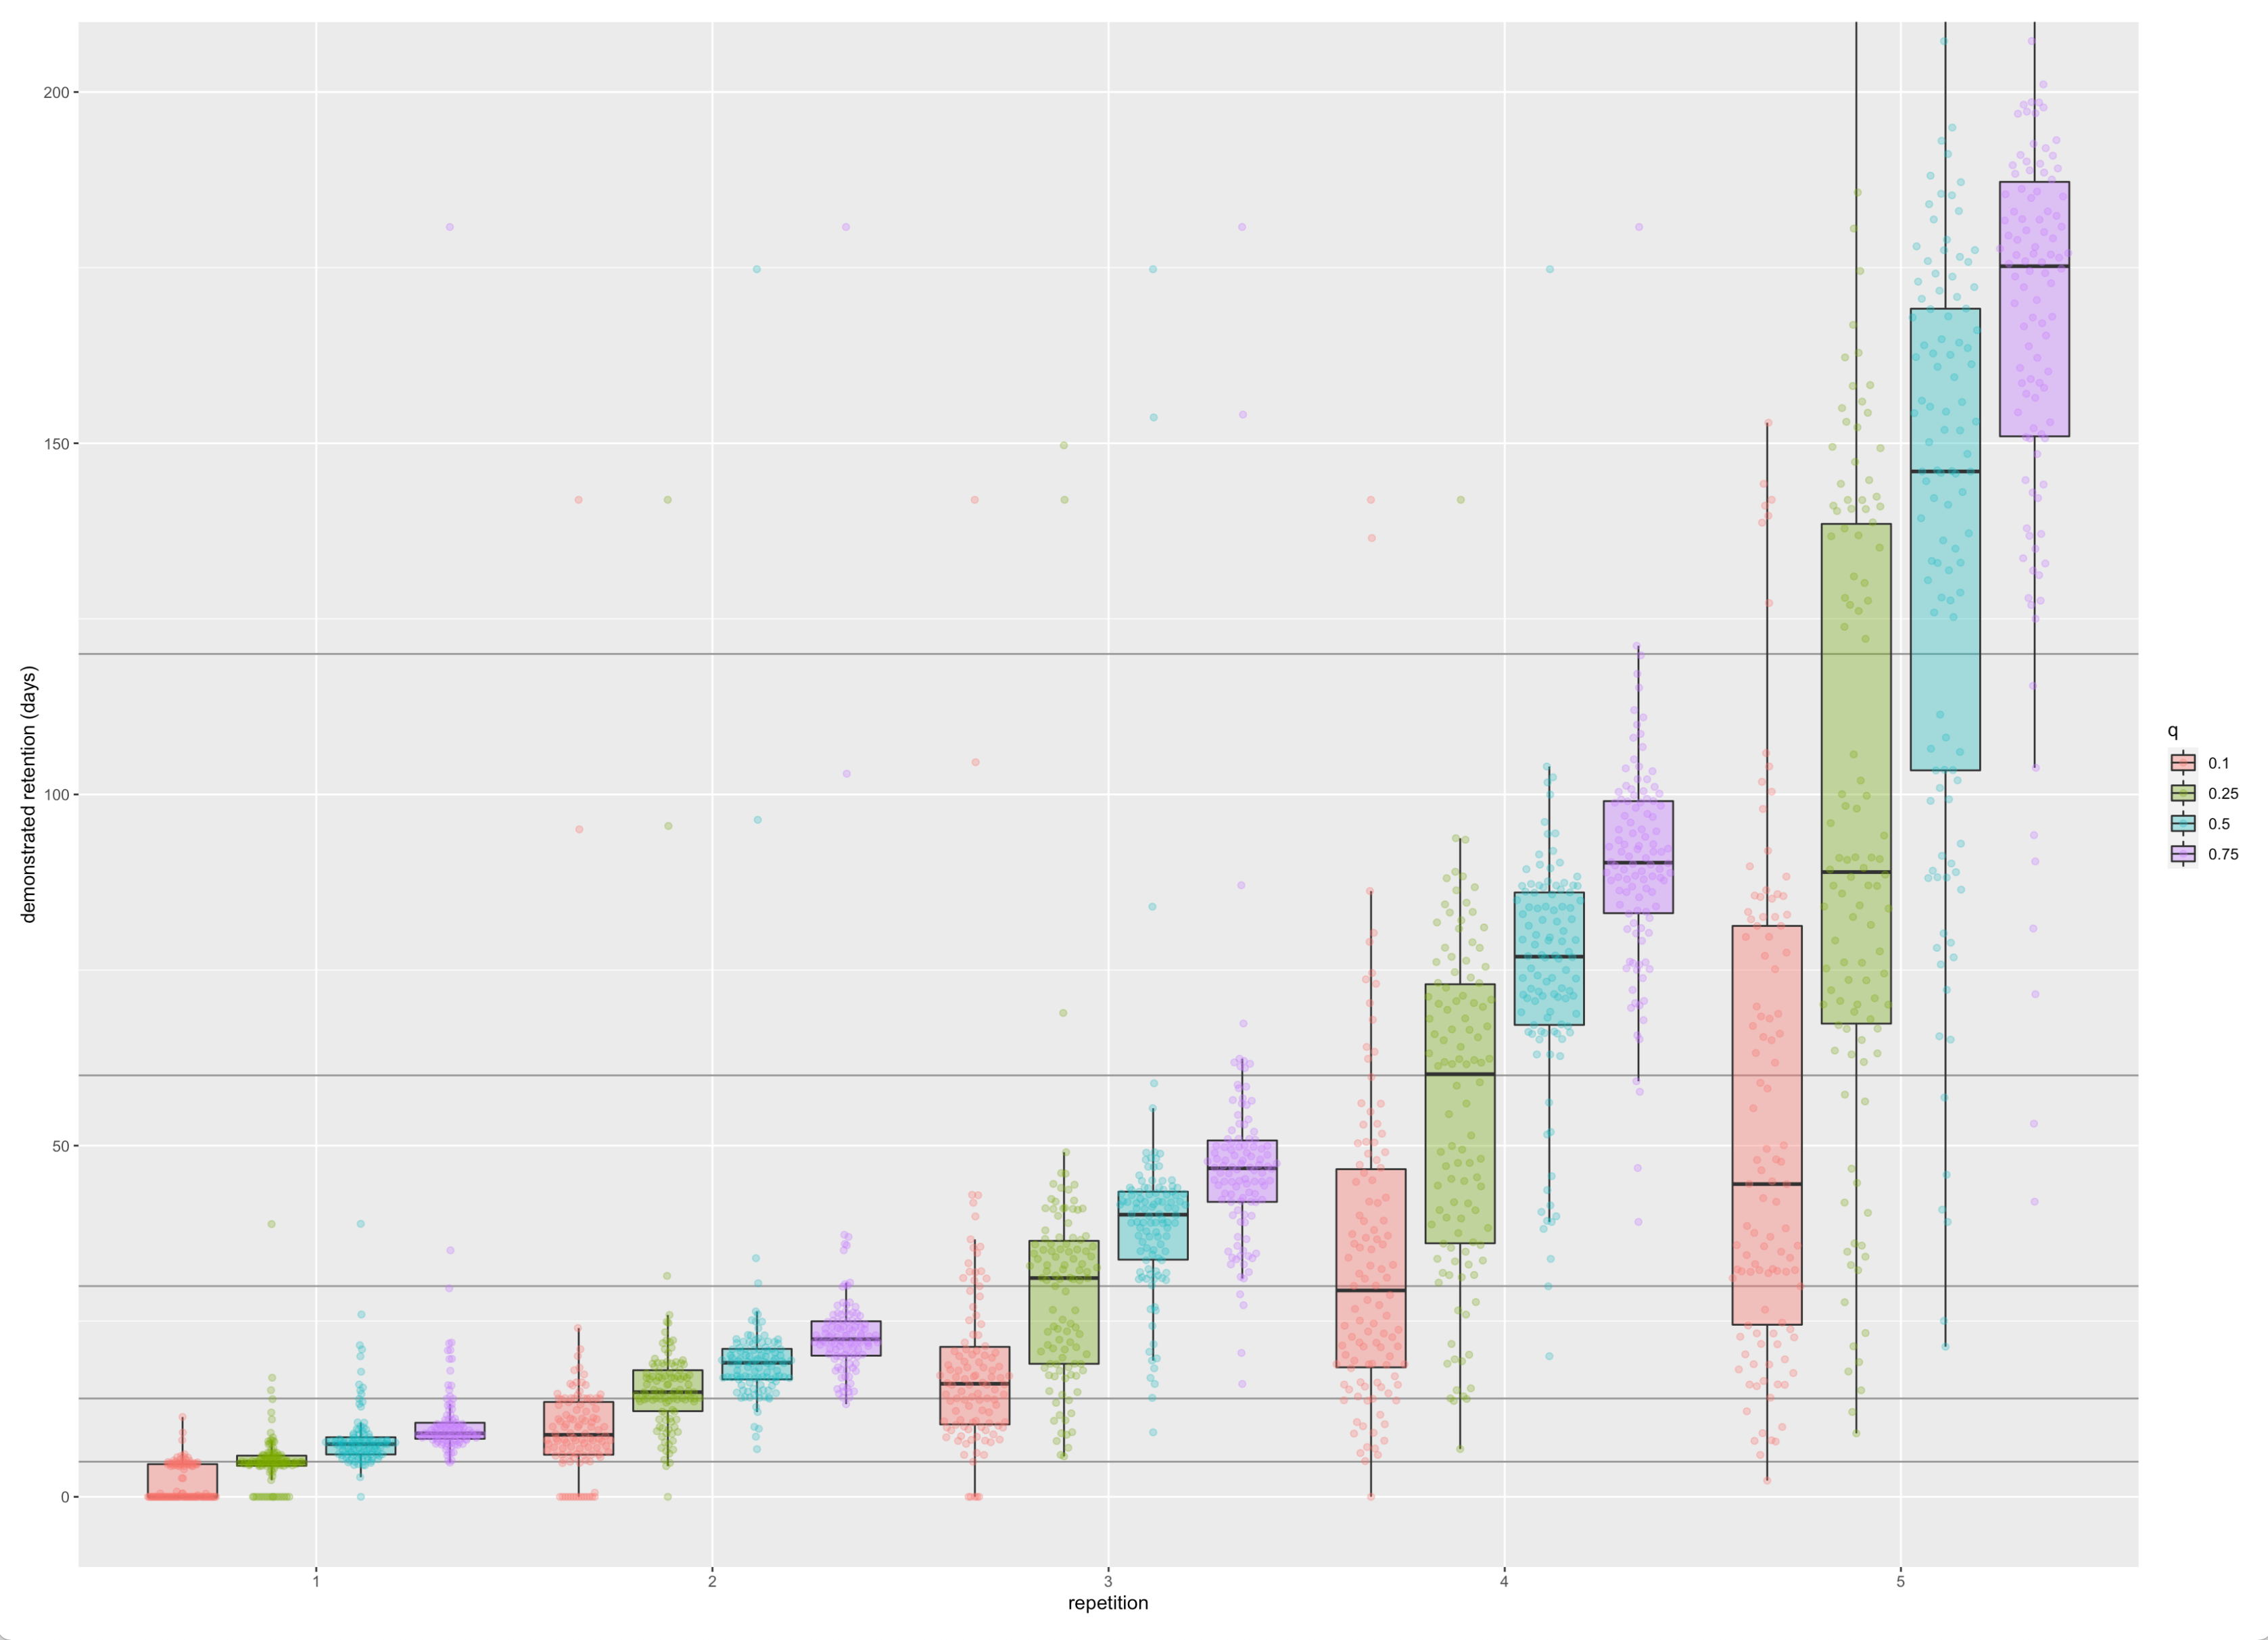
I’ve spent a couple mornings re-implementing demonstrated retention analysis in R. So I can now, e.g. plot demonstrated retention for all (qualifying) users of a single card (1iORGG8illPnVQltQ1kq); colors represent Q1-3 users by in-essay score: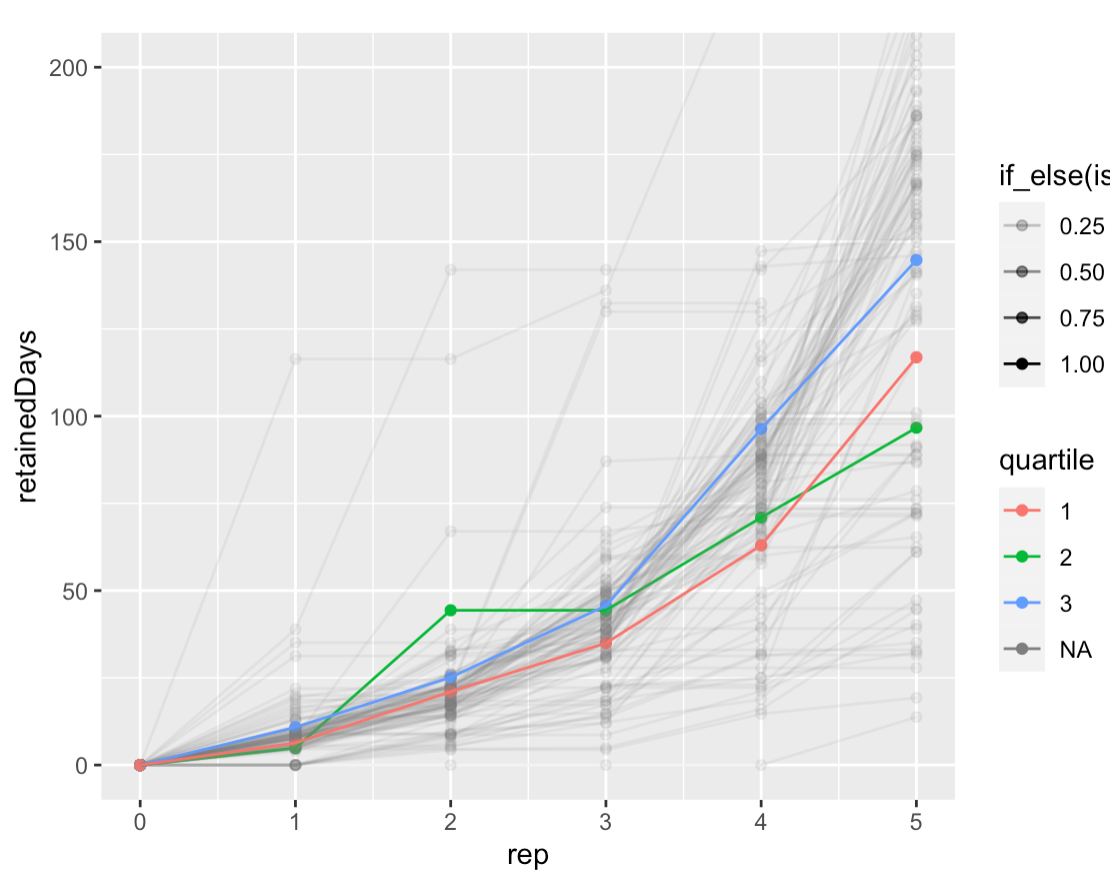
Here’s a Raincloud plot, which is much more instructive, though it loses the connections.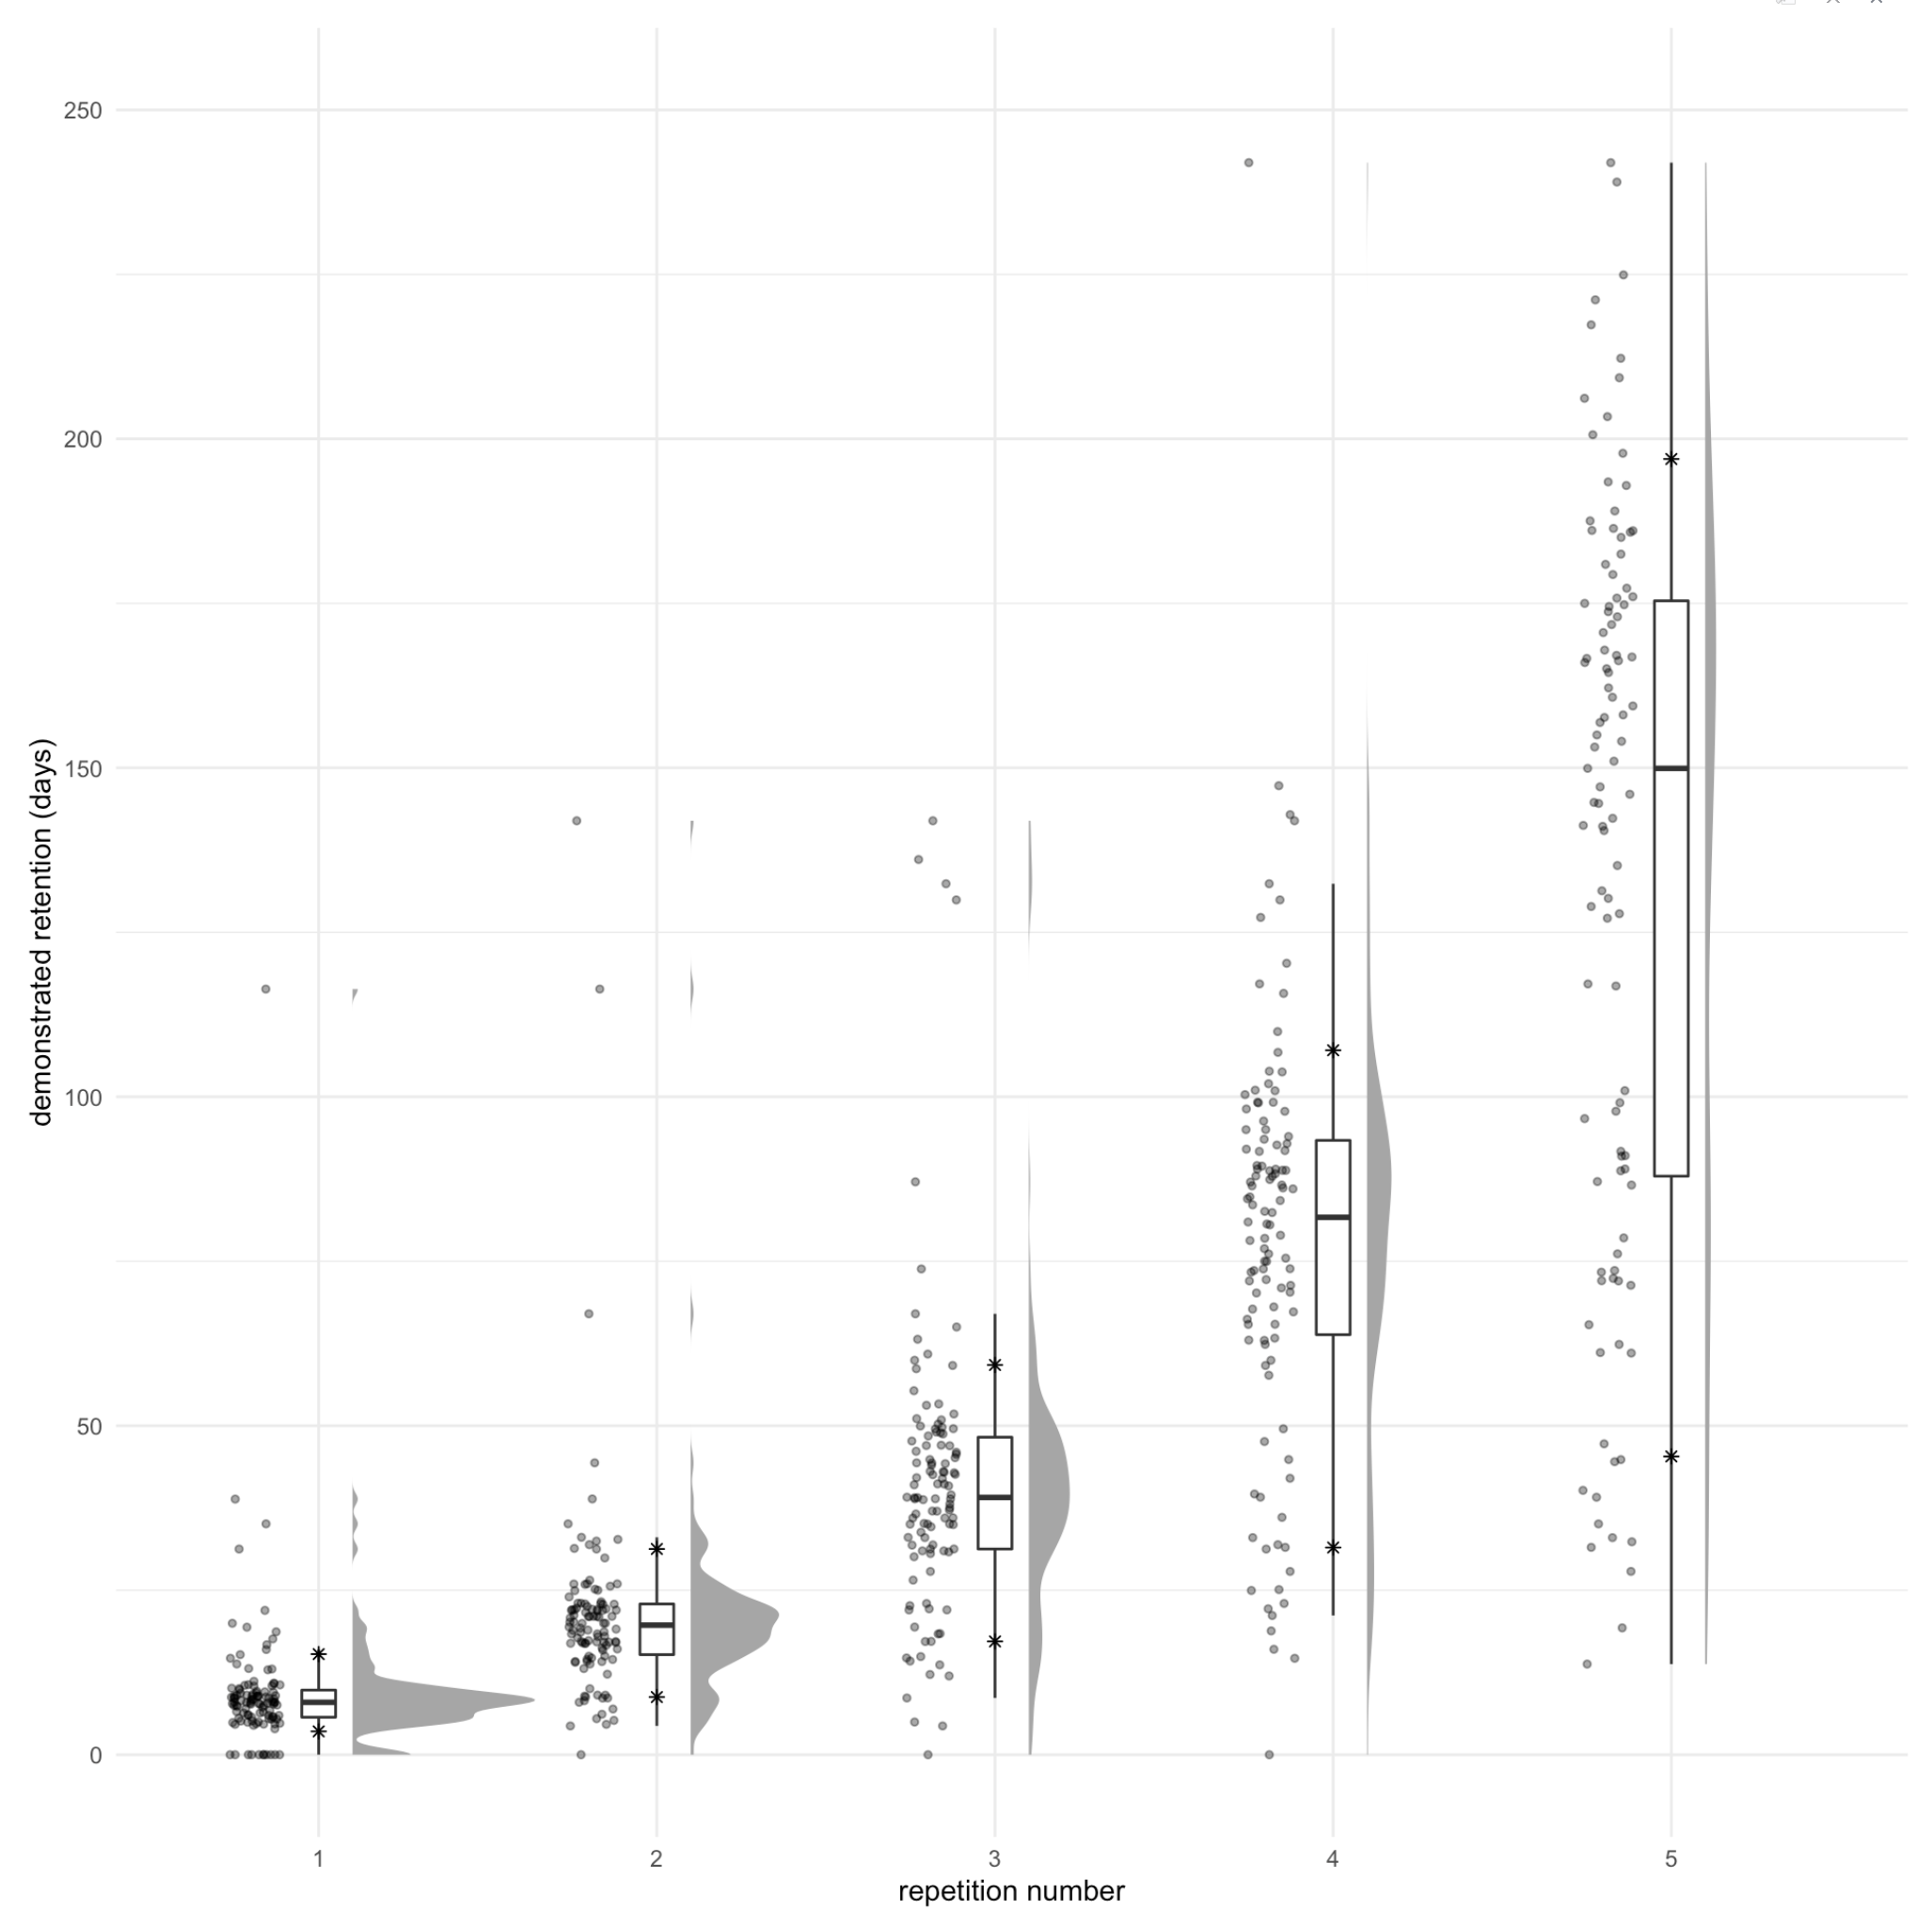
See chunk 20220215082229 in qc-analysis.rmd. Asterisks represents 10th and 90th %iles.
Notes on this figure:
- We see the bimodality we’d expect from the binary way these values are computed: the second “rump” represents people who forgot and were “left behind” the pack.
- The median user makes their way up the exponential as expected, but since we’re choosing the schedule, what this really represents is “the median user remembers the answer each time.”
- I also see exponentials in the 75th, and 90th %iles. And the 25th through the fourth repetition, but flattening at the fifth. But the tenth looks more linear. Linear is fine, potentially—it’s still ending up at a strong value.
- It’s misleading to “connect the dots” of these critical values here; they don’t represent the same user. So this graph is not suggesting that e.g. the 25th %ile reader has sigmoidal demonstrated retention.
- But it’s also not totally off base, given that there’s a lot of “jitter” in the sampling. In effect, these quartile stats are aggregating a bunch of different readers’ results in a way which should reduce the noise.
- These points really approximate a “lower bound” of these readers’ “safe intervals”. The bound is probably particularly loose for people in the “lower hump”, since they’ve been “held back” and could likely remember over longer durations, but they haven’t had a chance to demonstrate that.
- But in fact, these points are only sort of a “lower bound”, if we think about modeling recall as a stochastic phenomenon. Some of these points are “higher than they should be” because of “luck”.
Just for comparison, here’s a “hard” card, 17fsggSIuqxnhKFwOI2g, which asks for one of the values of the Y gate: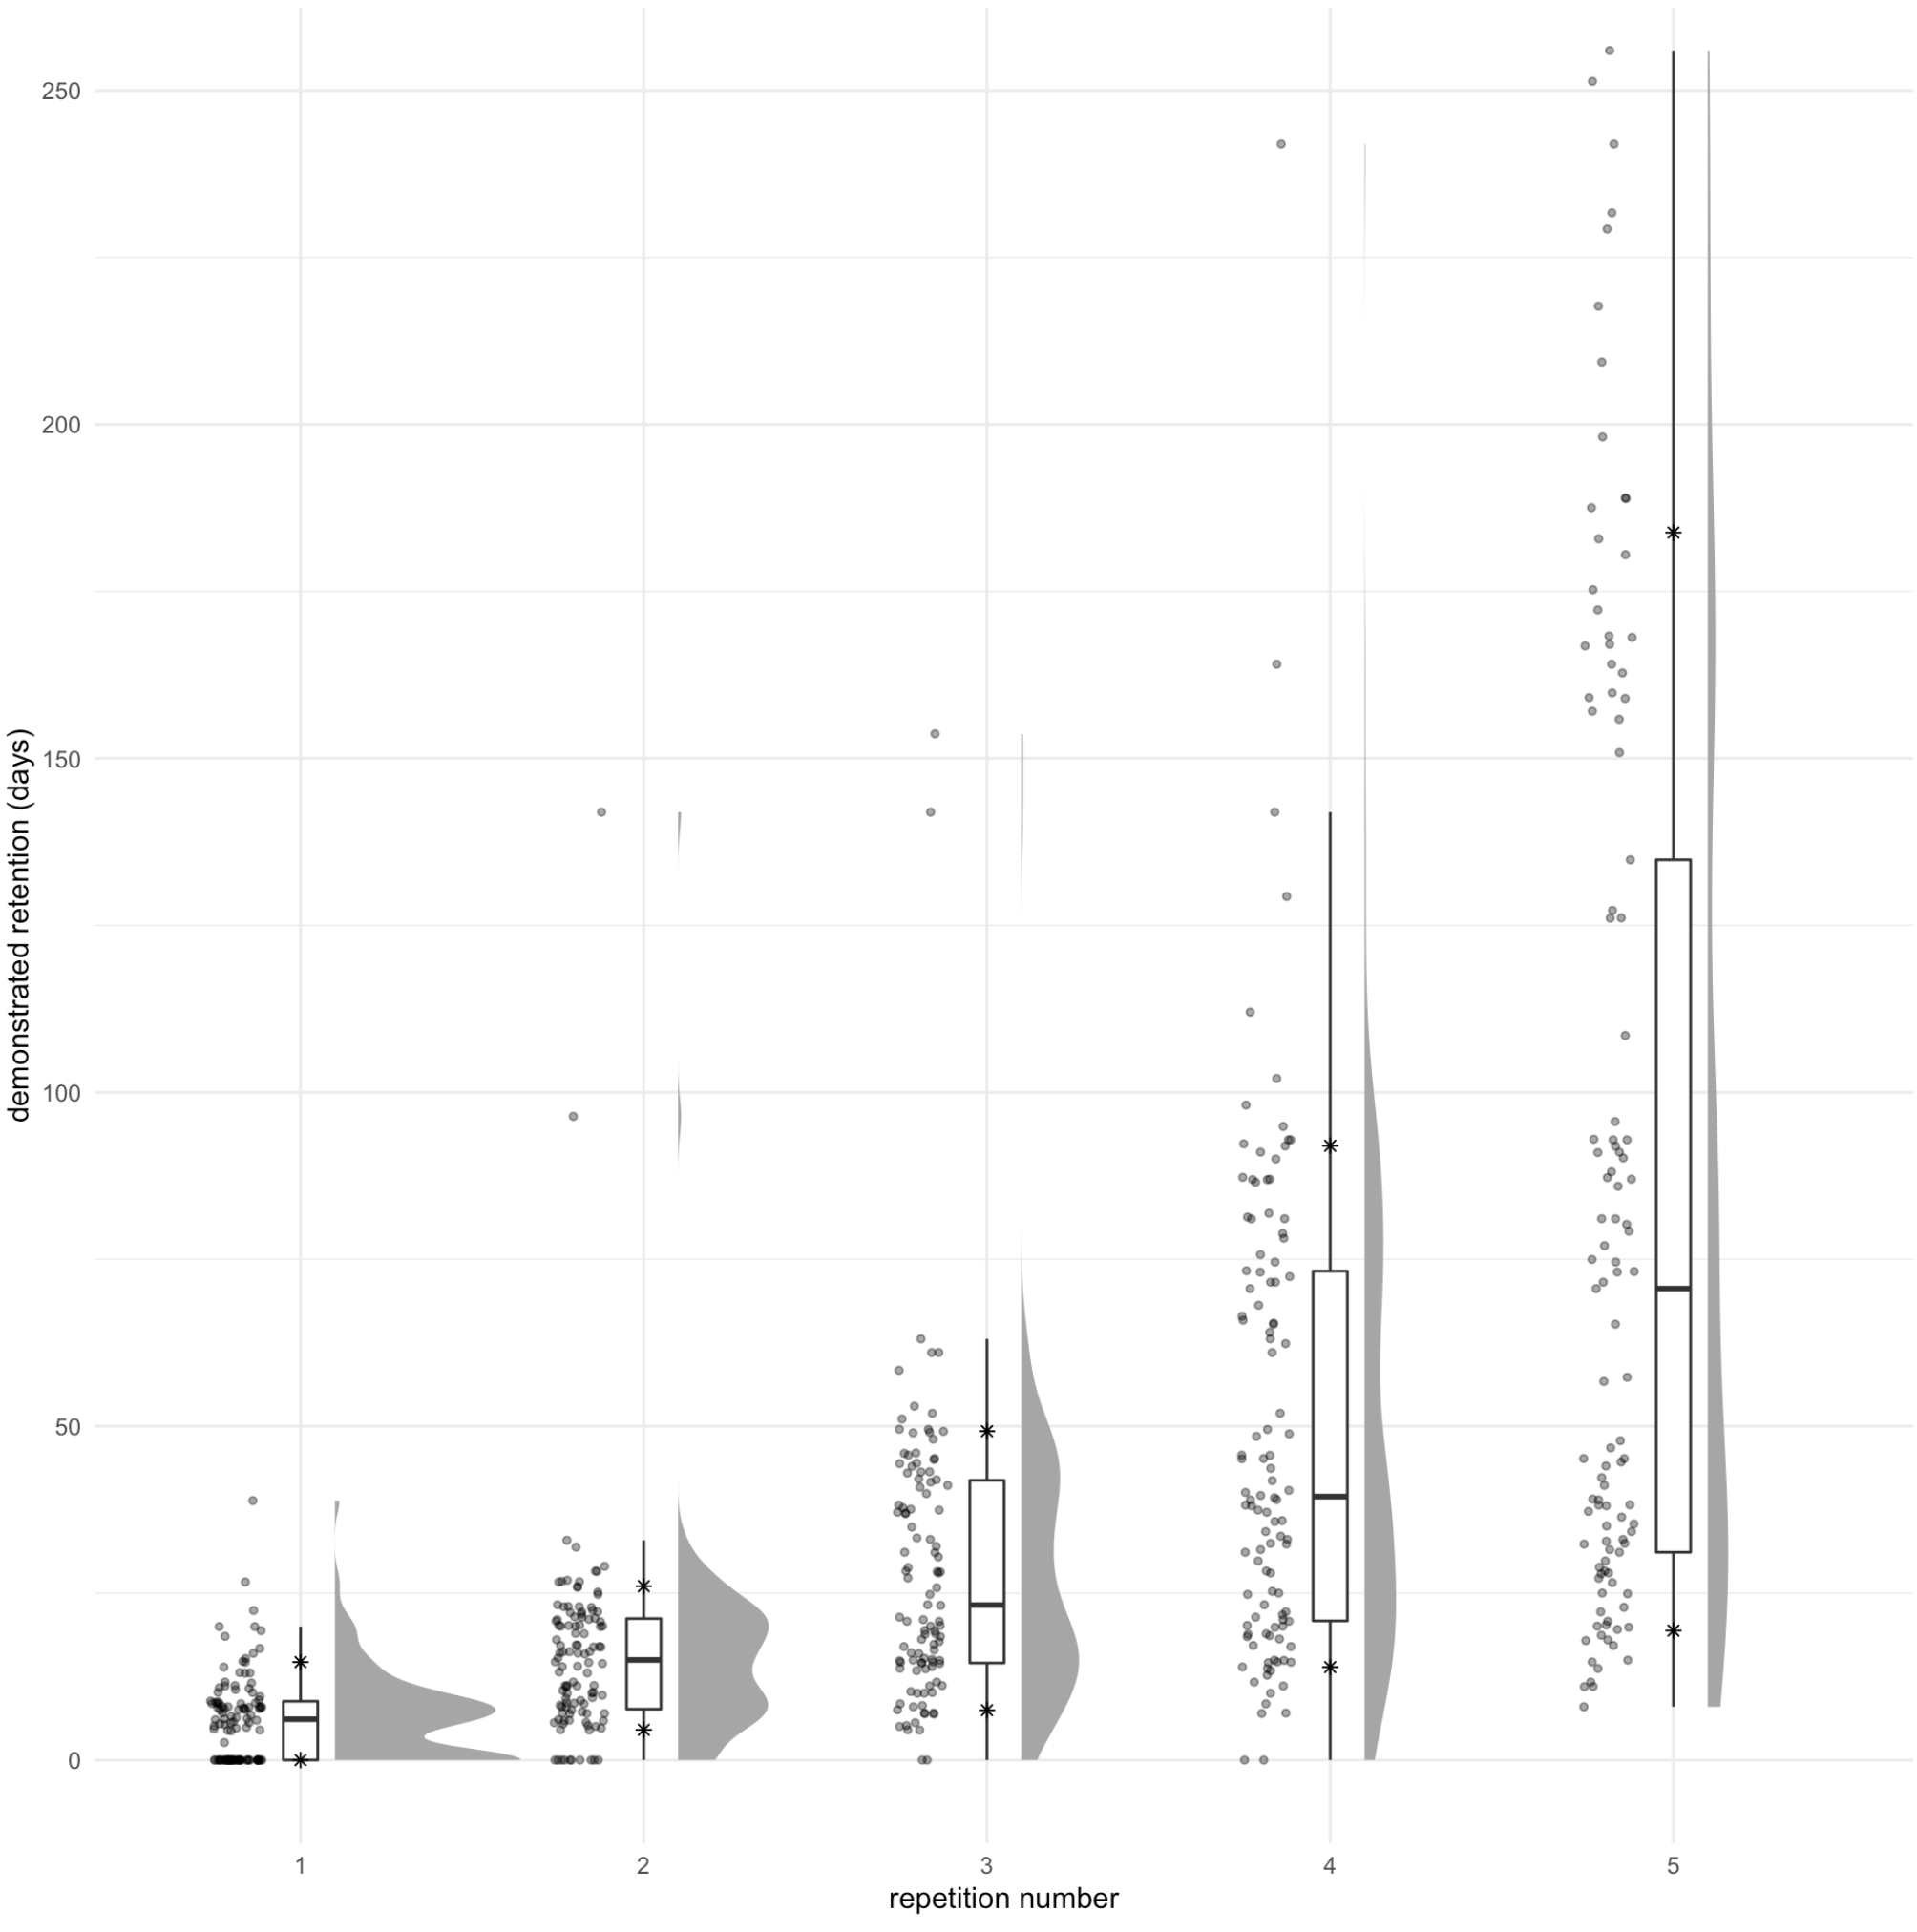
Here the exponential has disappeared for the 25th %ile too. And the apparent median value for the 4th repetition and 5th repetitions are roughly half what they were for the other card. You can see multi-modality quite clearly, representing the different number of successful recall attempts.
It makes sense that these values should be lower, but I’m not quite sure how to interpret the differences which this figure presents. The 90th %ile values are pretty close in these two figures. The second is a bit lower. But that’s not meaningful: in both cases, the 90th %ile just represents a reader who remembered the answer on each attempt. And so on their 5th repetition, they’d be asked to remember after 120 days. The true attempt interval depends on compliance, batching, etc. Noise, really.
The apparent exponential is also “forced” by our system. In truth, the “safe interval” for many of these users at the first repetition is probably in the weeks or months. So this graph exaggerates the relative benefit of practice, since the bound is likely looser at earlier repetitions.
And here’s the new schedule on the first card: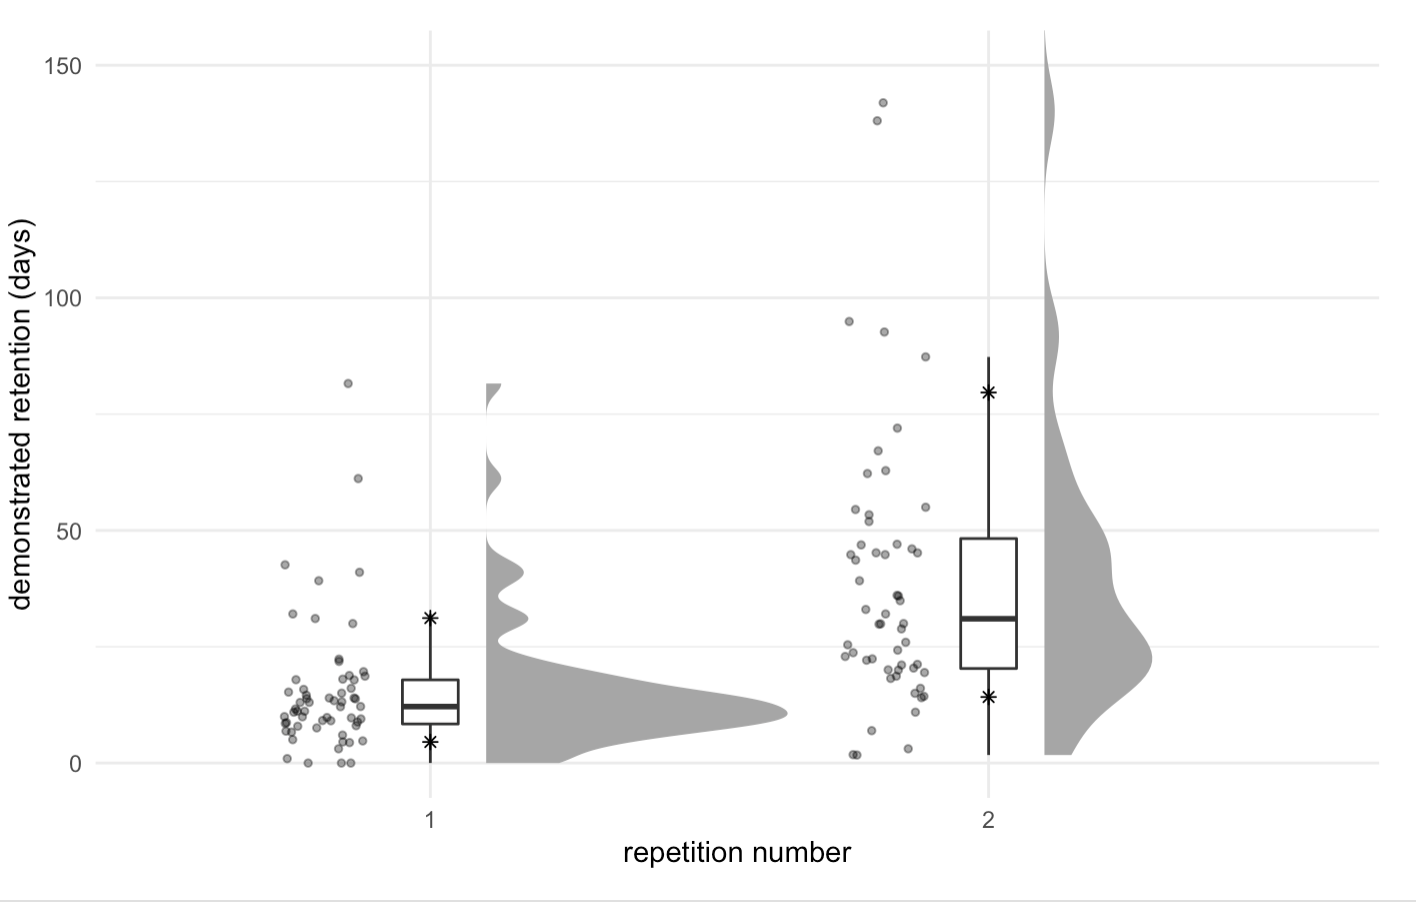
See chunk 20220215093014. Note the multi-modality. Not enough samples to examine many repetitions (just 58 readers here).
…
I think I’m conflating two goals: to answer “does it work?”; and to show some visual representation of Spaced repetition yields (what feel like) exponential returns for small increases in effort. The latter is much harder than the former. Maybe I can show the former in some very clear way, then gesture at the latter much more loosely.
How might I show the former? Ideally, in a way which doesn’t require models, which shows improvement over time / with more practice, and which obviously can’t just be chance? No need to also show the counter-factual here.
Ways to evaluate if “it’s working”:
- recall rates after two rounds of practice
- (doesn’t capture interval)
- recall rate at first attempt at interval X
- (doesn’t normalize for number of rounds of practice, encodes schedule)
% of readers who have successfully demonstrated one month retention
- seems subject to claims of binomial chance, though maybe I could disprove that with some stats
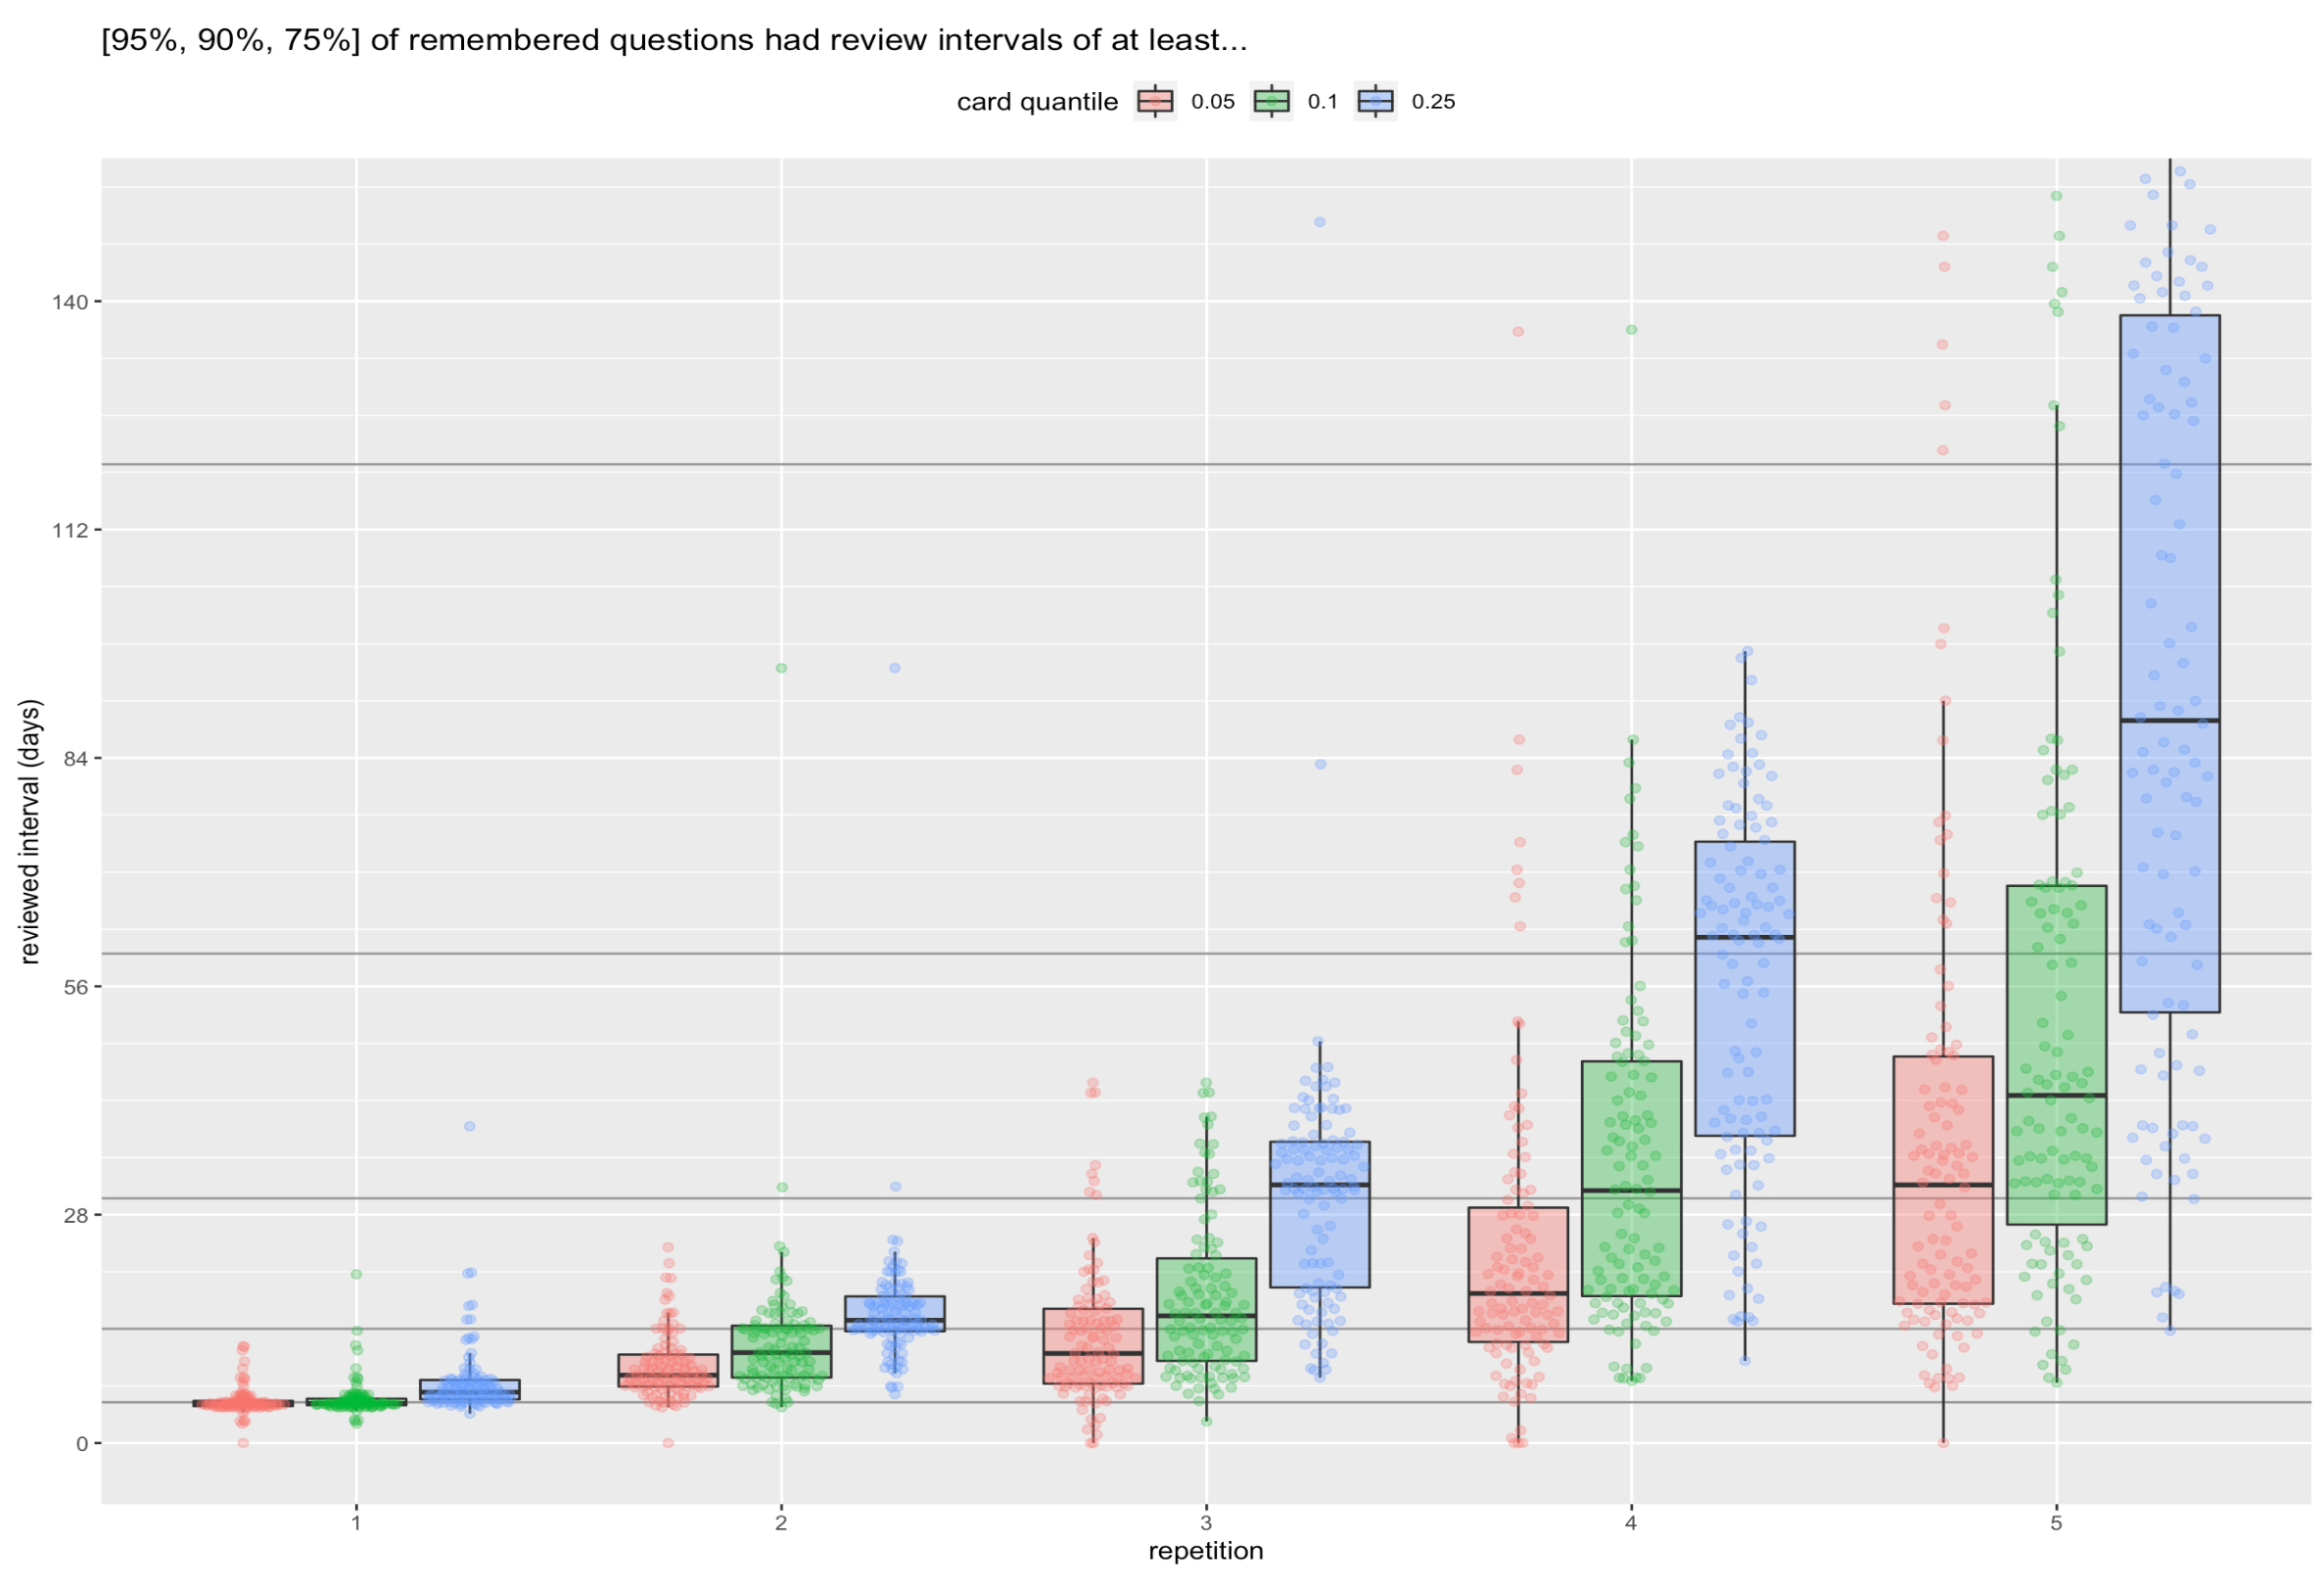
- here’s % of readers with 1+ month recall by card plotted:
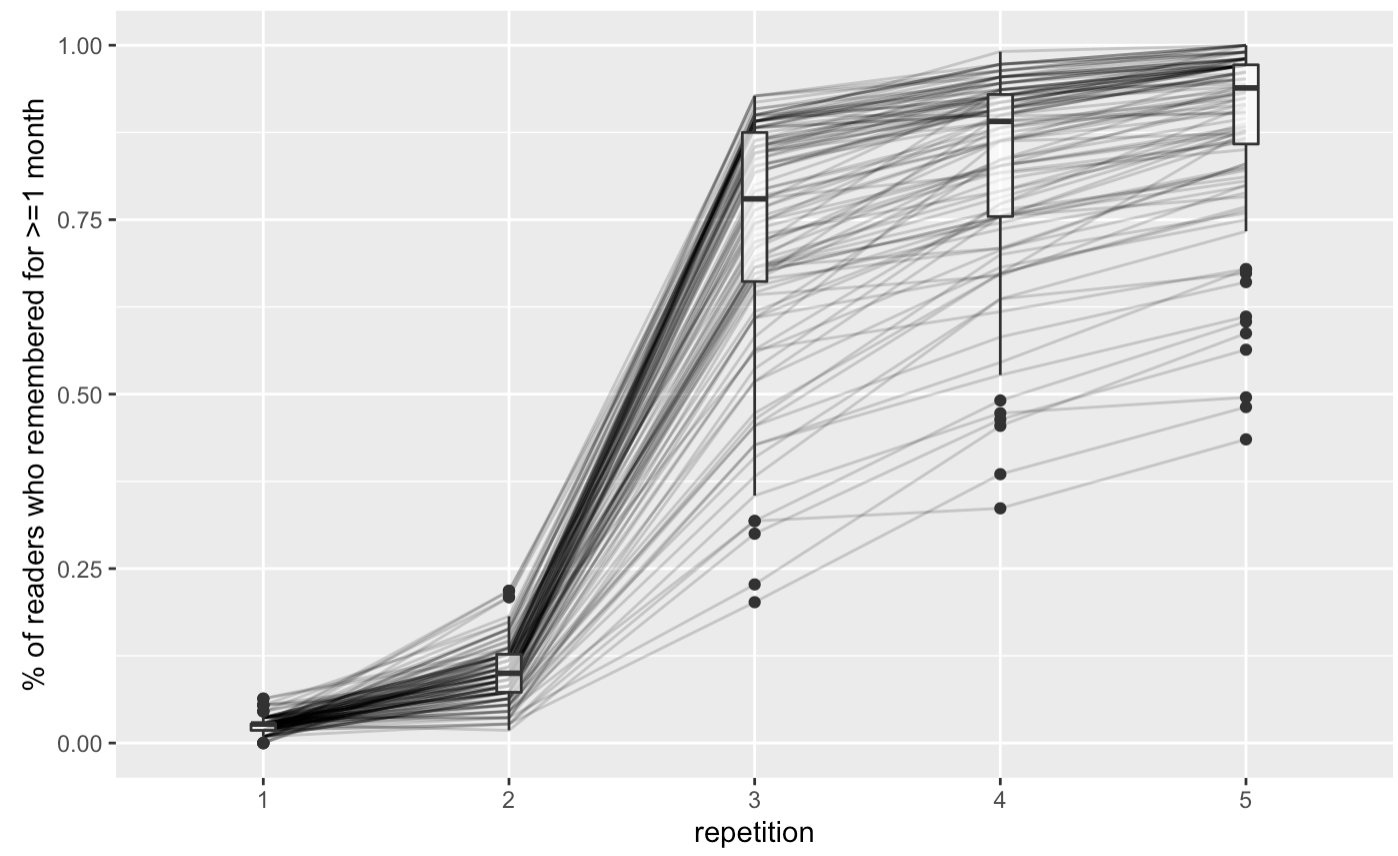 20220215111327 in qc-analysis.rmd
 - and here’s % of cards with 1+ month recall, by reader:
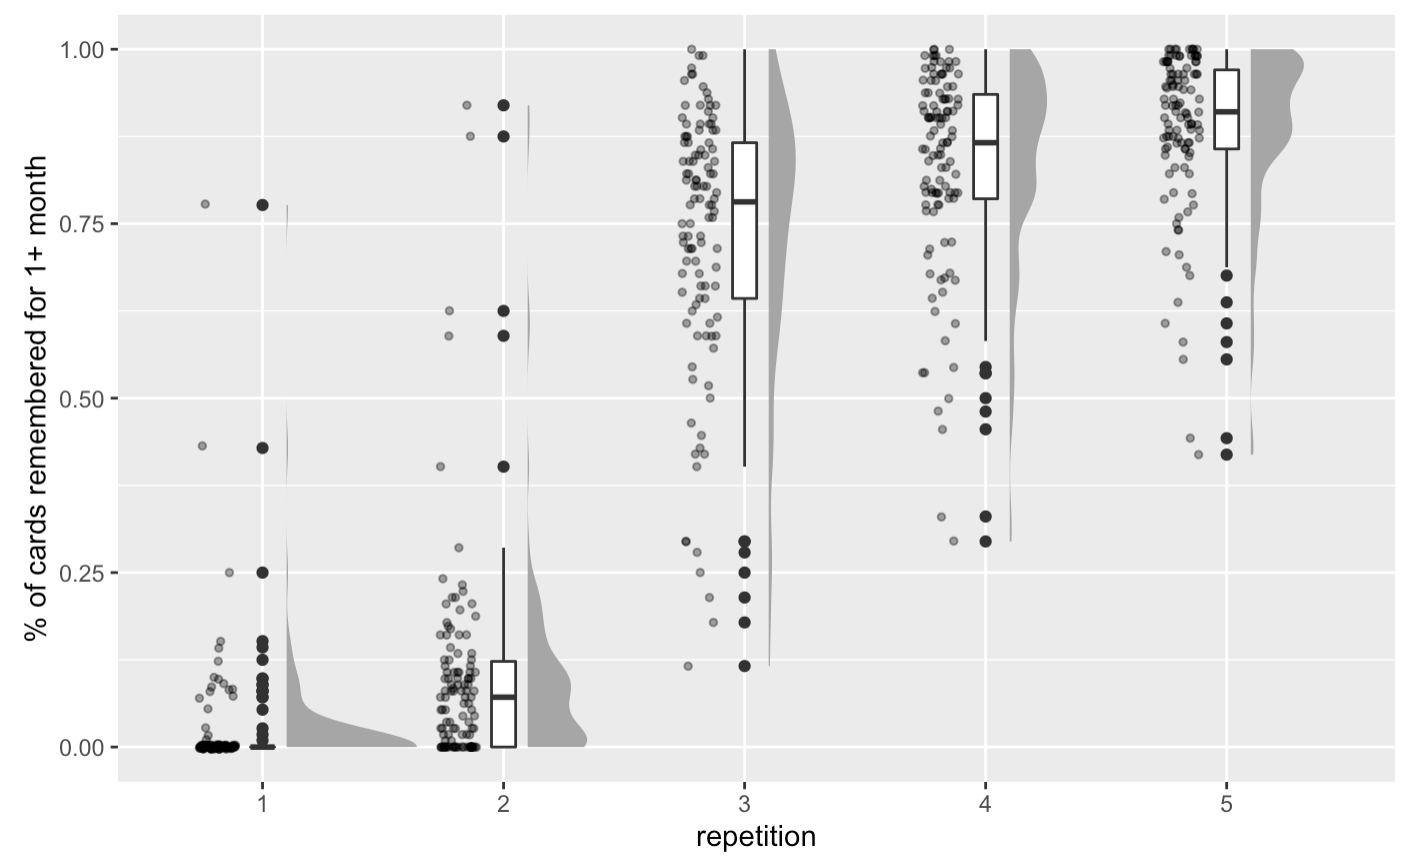
20220215111707 in qc-analysis.rmd
look at the median / 25th %ile reader… what’s their situation?
- demonstrated retention at various card %iles
 20220215124135
 20220215124146
- What % of readers achieve X days of demonstrated retention, by repetition?
- Here’s one plot addressing that for
17fsggSIuqxnhKFwOI2g: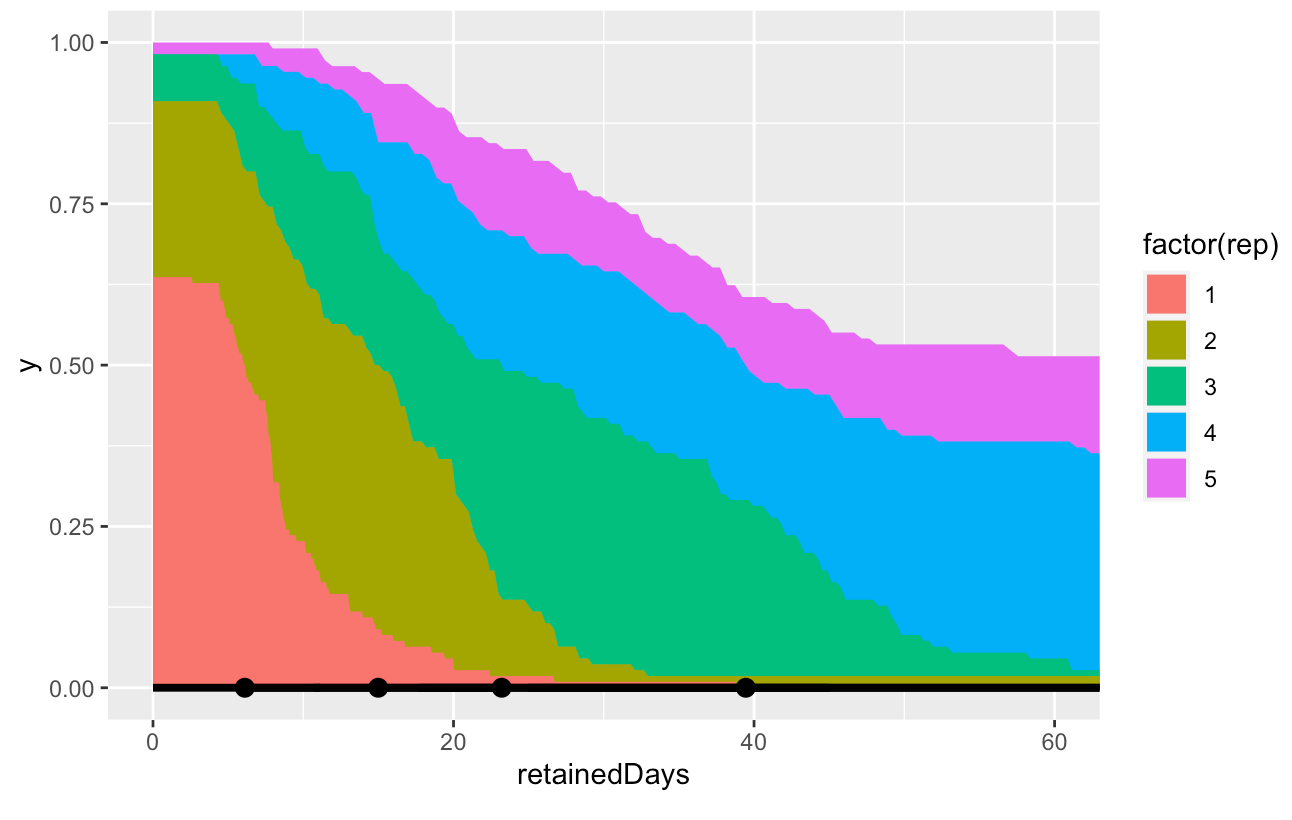 20220215162158
- Here’s one plot addressing that for
2022-02-09
Let’s say that I had Giacomo Randazzo’s memory model implementations, and I ran them on QC data. What kind of narrative could I write? Would I buy it?
One way to evaluate these systems is to ask: how many repetitions are required to reach a high degree of stability? That is, until recall rates would still be quite high even after a month or two away? We can’t directly measure that, but we can predict it with this model, which does successfully predict reader recall elsewhere quite accurately.
Yeah… I guess I just don’t really buy this. I mean, it might be fine as a way of iterating on the system, or of comparing schedule A vs schedule B. Curve fitting doesn’t tell a very strong story. It’s certainly not the primary way I’d like to demonstrate the system’s success.
To broadly demonstrate the success of the system, I think I’d rather say something quite broad and intuitive. Ideally, it should surface an exponential which demonstrates that linear effort produces non-linear returns.
Alright… what is it that increases exponentially with linear practice? In expectation, the interval of time which one could “safely” wait without practice. We could call this your “safe retention interval.” A (lossy) proxy for this is the amount of time you’ve demonstrated your recall successfully. It’s not ideal because you could have demonstrated that recall by luck, and because it may actually understate your potential retention: you may have hit a given safe retention interval several repetitions earlier, but you didn’t get a chance to prove it.
Looking at the 10th %ile demonstrated retention seems to sort of approximate what we’re looking for, if we want a “safe” recall rate of p=0.9. … Is that true? Say that your entire library of cards really did have a safe retention interval of 1 month, with p=0.9. The most likely observation, then, would be 90% of your cards demonstrating 1 month, and 10% demonstrating some previous lower interval. However, it’s also somewhat likely that e.g. 87% of your cards would be demonstrated at 1 month, and 13% demonstrating some previous lower interval, as well as 93% / 7%. Looking at the 10th %ile, maybe these possibilities balance each other out?
The problem with naively looking at card %iles in demonstrated retention is that the cards absolutely aren’t uniform. The true “safe interval” for the 5th %ile card isn’t the same as that of the 50th %ile card.
Can I slice by card? Users are more uniform than the cards are. So looking just at card X, at repetition 5, I can say what % of readers have demonstrated retention at various levels. If 90% of “median-ability” readers have demonstrated retention above some level X, I guess I feel comfortable saying that the “safe interval” for those users is probably bounded below by X.
2022-02-08
New thought this morning regarding How to consider cost benefit tradeoffs of practice vs retention in spaced repetition memory systems?: can I roughly model both retrievability and stability by requiring:
- 90% retrievability at session N
- 90% retrievability at session N+1, one month later
This seems pretty good, except that I do still have the problem of inconsistent schedules. Say that I have 90% retrievability at repetition 2. The 10% who failed won’t get a chance to try again one month later—they’ll be asked to try again sooner than that. So the pool of one-month-later people will be skewed towards those with better memory performance. The same is true, to a lesser extent, recursively across the preceding sessions. The people who even have a shot at one month retention are skewed high-ability.
Can we approximate this by asking “how many sessions does it take for X% of readers to achieve one month retention?” I think there’s a relation between the two. One problem with this framing: say that for a schedule with an initial interval of one month, P_recall is 0.4. So I’d produce a statistic that says “wow! 40% of readers can remember even with this little reinforcement!” But that’s just a matter of chance. Accumulating these chance successes over time will produce a total of 0.9 after a few sessions even if the probability is low each time. With p=0.4, if they have 3 chances, they’ve got a 94% chance of success in at least one of those chances.
All this really makes me question my prior metrics of demonstrated retention. It’s good at least that Demonstrated retention reliably bounds future recall attempts on Quantum Country; that’s some evidence that what I’m seeing isn’t just a matter of chance. But I still feel I’m far from a good “is it working?” metric.
If P_recall is 0.5 at all stages, then after five repetitions, 96% would have demonstrated one week retention; 54% would have demonstrated two weeks; 27% would have demonstrated one month; 6% would have demonstrated two months. At P=0.7, we’d see 100%, 82%, 60%, and 30%, respectively. This feels pretty distorted. 20220208103440
Now, if I saw that among a specific set of users at a particular repetition, 90% of them were able to recall the answer correctly, I’d feel decent about suggesting that approximates P_recall=0.9. The difference, I guess, is the “multiple chances” element. The problem with using the smooth-brain sampling method I describe is that the cohorts get skewed by the dynamic scheduling. If everyone’s schedule were exactly the same, I think I’d believe in dumb sampling. Bluhhh. I guess I need to use a model to really get anywhere here.
Is there a smooth-brain way of assessing the system’s success, one which is resilient to “just try one month immediately lol”? I wonder if I can see the impact of stability on week-over-week retention at a first repetition of one month. For the “median” card, eugu7LKeiO34xF1ParBu, I get 82% / 93% / 91% for 4, 5, and 6 weeks, N=11/28/11. 20220208113105. For a “hard” card, 1ENYKL02RT8aidhI917F, I get 59% / 67% for 4/5 weeks, N=22/18. Eh.
Really, I’d like to find some way of measuring—or at least convincingly estimating—stability directly at repetition N.
2022-02-07
The trouble I’m having as I think about stability is the same as the one I was stuck on a year and a half ago: I’m trying to approximate the probability of recall by using recall rates within cohorts of users. That approximation works to the extent that an individual user in the cohort is a good approximation for the whole cohort. I can control for more degrees of freedom now than I could then (i.e. through different schedules, and because I now see that Quantum Country readers who complete first review don’t have strongly skewed in-essay accuracies). But the fundamental problem remains.
So one thing I’ve been doing is to look at cohorts along particular paths—e.g. those who have successfully remembered three times. Such cohorts will be more internally similar than less-conditioned analogues, but this approach makes it difficult to talk about the schedule as a whole. Because the review schedules are dynamic, cohorts diverge in their timing fairly rapidly—we’re no longer comparing like with like.
One alternative is to ask threshold-based questions. For instance: how many repetitions did it take to demonstrate one month retention, with high stability thereafter? This question must be refined in several ways.
Say that the true value is something like “on their Nth repetition, the median user will attempt recall over 1+month and succeed with p=0.9”. How can we translate this into things we can actually measure? At least without a model, we estimate probability with recall rates, so we can never make exactly this statement.
But we can maybe say something like: “on their Nth repetition, 90% of readers whose in-essay recall was in Q2/Q3 succeed in demonstrating recall of 1+ month.” We can solve for N (if such a solution exists). We can specify for what % of questions this statement holds. This is satisfying enough, for now, I think.
The second piece is stability. Two framings that come to mind:
- after the repetition in which they demonstrate one month retention, recall falls slowly: one month later, they still have 90%+ odds of recall
- at the time of that successful one month repetition, we see very little decline in recall over the subsequent weeks (this is a stricter standard)
The latter roughly corresponds to “sufficient stability that a one month delay produces only a 10% drop in recall,” which sort of matches our intuitions that it’s built durable recall.
One we can compare schedules is to ask: for what % of cards is this true? We can also look at the extent to which it’s almost true.
So the criteria I’m looking for in a repetition N is:
- of readers with in-essay accuracies in Q2 or Q3…
- 90%+ are attempting an interval >= 1 month
- 90%+ of those attempting succeed
- this is true for X% of cards
- … and forgetting is slow in the weeks thereafter
First tried this with 17fsggSIuqxnhKFwOI2g, and it looks like it never converges. 20220207122212. Trying the card with the median first review accuracy, eugu7LKeiO34xF1ParBu (“The simplest quantum circuit is a wire”), I see the repetition 5 almost qualifies (86% of readers trying for 1+ month; 99.7% of those succeeding), and repetition 6 does qualify. Constraining just to aggressiveStart schedule, repetition 3 almost qualifies (88% / 99%) and repetition 4 does qualify (92% / 100%). OK! Now we’re getting somewhere.
Let’s look across all QCVC cards. By repetition 4, the median card has 88% of readers trying for a month; 85% both try for a month and succeed. 60th %ile crosses 90% for the joint probability. The 20th %ile card has 70% of readers trying for a month; 66% both try and succeed. The 10th %ile card has joint probability of 56%. Not controlling reader pool very carefully here; N varies from 132 to 284 depending on card. I’ll tighten this down later. By fifth repetition, the median card has a 92% joint probability, and 40th %ile has 87%. 20220207125100
It’s nice to pin down these figures, but they’re actually not that encouraging. Only roughly half of cards qualify as “learned” by repetition 5? I wonder if we’re seeing a lot of population skew in these samples because readers who forget cards will have extra repetitions. Let me try looking just at people who completed 4 repetitions of everything. 20220207130354 Alright, this looks more promising. In the fourth repetition, 30th %ile is at 85% joint probability; 40th %ile is at 87%; median at 91%. In the fifth repetition, the 30th and 40th %ile joint probabilities are 88% and 92% respectively. Restricting to the subset of users who completed five repetitions, the results look pretty much the same.
But it’s also worth noting that among people who are attempting 1 month intervals at the fourth repetition, 92% of them are successful at the 10th %ile. It’s just that only 76% of people are attempting to recall the 10th %ile card. I’m having trouble figuring out how to think about this. The joint probability is an underestimate because it fails to include some people who would remember at one month if they had a chance to try; the conditional probability is an overestimate because it excludes people who failed to remember and needed a make-up session or two. So, I guess at least they’re upper and lower bounds. But their diversion suggests that my attempt to “control for reader ability” isn’t working very well. On the third repetition, the conditional probability at the 10th %ile is 88% (but only 60% got the chance). Now, the third repetition is the first time you could have a shot at this in that schedule without being late / non-compliant.
I think I’m too high up the ladder of abstraction. “Compared to what?” Is this working well? Do these numbers really indicate “stability”?
2022-02-04
One way to think about How to consider cost benefit tradeoffs of practice vs retention in spaced repetition memory systems? is to try to use stability as a key metric. Intuitively… if we could actually measure this hidden variable, we’d like to minimize the amount of effort expended to achieve a high degree of stability for an item. We don’t necessarily need to see the reader prove that they have high retrievability if we can demonstrate high stability—and if we can prove that stability is sufficiently predictable.
How might I model stability from the data I have, without using some complicated regression model? Mozer, M. C., Pashler, H., Cepeda, N., Lindsey, R., & Vul, E. (2009). Predicting the Optimal Spacing of Study: A Multiscale Context Model of Memory. In Y. Bengio, D. Schuurmans, J. Lafferty, C. K. I. Williams, & A. Culotta (Eds.), Advances in Neural Information Processing Systems 22 (pp. 1321–1329). uses different constants in its leaky integrators’ activation strength according to recall success. Mozer, M. C., & Lindsey, R. V. (2016). Predicting and Improving Memory Retention: Psychological Theory Matters in the Big Data Era. In M. N. Jones (Ed.), Big data in cognitive science (pp. 34–64). incorporates successes/failures into the review history via separate learned weights. I don’t love either of these approaches.
This graph from Eglington, L. G., & Pavlik Jr, P. I. (2020). Optimizing practice scheduling requires quantitative tracking of individual item performance. Npj Science of Learning, 5(1), 15 is tantalizing… can I produce something similar?
Well… one thing I notice about this image is that once stabilities get pretty long, they look surprisingly linear. And they’re probably mostly linear in the >0.9 regime? Maybe I can just approximate stability linearly to start.
If we model retrieval with a power law, i.e. m(1 + ht)^-f, then stability must be encoded in f. But it’s interesting that in Two-component model of memory, by contrast, it’s modeled with exp(-t/S), i.e. with time in the exponent.
Alright… enough theoretical mindset. What can I see? Honestly, not much. Looking at xiNW1zgeb2ITHGi6uQtg (a “hard” card), for readers who remembered in-essay and in their first session, and bucketing by clock-time review interval, I see recall rates of 93%, 87%, 95%, and 80% for 2, 3, 4, and 5 weeks respectively. So… well, OK, these people could double their interval without suffering much. That’s not so outlandish. 20220204123058 Using 1ENYKL02RT8aidhI917F, which has a 42% in-essay recall rate, I get similar figures.
OK, but those two cards are a bit wonky because I used them for the 2020-01 trial. Trying 17fsggSIuqxnhKFwOI2g, about the value of the Y gate. For third review (first two successful), I get 84%, 82%, 88%, 94% for 2, 3, 4, 5 weeks. (Why increasing?? Interference?) For fourth review (first three successful), I get 98%, 89%, 90%, 78% for 5, 6, 7, 8 weeks.
For people who forgot in-essay and then remembered in their first review, I see a clear example of poor stability: 81%, 79%, and 68% at 2, 3, and 4 weeks, respectively. For xiNW1zgeb2ITHGi6uQtg, I see 81%, 76%, and 67%. For 1ENYKL02RT8aidhI917F, 67%, 70%, 68%. 20220204125007
Maybe I can compare schedules by looking for “the most efficient schedule necessary to reach 90%+ at 1+ month, with slow declines week-over-week thereafter”.
1ENYKL02RT8aidhI917F doesn’t seem to quite be passing that test on Quantum Country right now: 88%, 85%, 88%, 87% for 5, 6, 7, 8 weeks. But it’s close. So maybe a good place to start? 20220204154812
2022-02-03
Looking at the data from 2020-01 Quantum Country efficacy experiment, I see that people in the bottom quartile of in-essay accuracy have a recall rate of 23% and 25% respectively for the two hardest questions with no intervention at all (N=53/60). 20220203085026 Nice to see that pattern continue.
OK, so if you’re in the bottom quartile, you really are gonna struggle without aids. Can we say the opposite—does the 1+3 pattern work for the bottom quartile? I see 75% / 60% (N=4/5, alas; 20220203085524)
What if we just look at repetition 3, 4, 5, etc? Does it converge? No! For the bottom quartile users, it doesn’t! 20220203091948 Repetitions 3, 4, and 5 are 66%, 75%, 73% / 70%, 76, 78% for the two hard cards at the bottom reader quartile. That’s pretty interesting.
(BTW, in-essay accuracy for these cards is 64% / 60% with no constraints on user pool)
The story here, as it’s shaping up:
- Hard cards need support to be recalled at one month:
- Hard cards have low recall with no support (42% / 42%)
- With in-essay practice and make-up sessions, recall rates rise to 71% / 68% at one month
- With an extra round of practice at one week, recall rates rise to 90% / 90%.
- Easy cards don’t need much support:
- Easiest card in my sample has 89% recall rate with no support
- With in-essay practice and make-up sessions: 91%
- With an extra round of practice at one week: 100%
- But the situation also varies by user. For people whose in-essay accuracies were in the bottom quartile of in-essay recall rates…
- The hard card figures are: 23% / 25%; 62% / 58%; 75% / 60% (tiny N)
- The easy card figures are: 79%; 93%; 100% (tiny N)
- Whereas for people in the top quartile of in-essay recall rates (>= 95.7%)…
- The hard card figures are: 56% / 65%; 67% / 86%; 100% / 100% (tiny N)
- The easy card figures are: 97%; 87%; 100% (tiny N)
There’s an obvious inconsistency in that very last sequence. Could be due to the folks in the 2020-01 trial getting reinforcement from other cards… not sure.
But the overall counterfactual story is shaping up here with this data. Everyone needs support for hard cards; low-ability readers need support for easy cards. So… what about for “middling” cards? We don’t know yet! I don’t think I want to dig into this at the moment.
This data isn’t very clean. If I want to tell this particular story, I can gather new data making a more head-to-head comparison. But I think it’s enough for my understanding now. I’ve pushed through my confusion around Quantum Country users seem to forget most prompts quite slowly: I do indeed see a forgetting curve—it’s just steeper for some readers and prompts than for others. Some readers/prompts experience relatively little forgetting, and that’s fine; we can make the experience more efficient for them. I can make a real case for the counter-factual.
But my picture of the positive case is hazier now! I don’t know how to think about the relative value of in-essay review given the substantial extra time cost. How should I compare these new schedules? How can I evaluate a potential change?
Eglington, L. G., & Pavlik Jr, P. I. (2020). Optimizing practice scheduling requires quantitative tracking of individual item performance. Npj Science of Learning, 5(1), 15 uses a fixed amount of study time to evaluate these trade-offs. Nioche, A., Murena, P.-A., de la Torre-Ortiz, C., & Oulasvirta, A. (2021). Improving Artificial Teachers by Considering How People Learn and Forget. 26th International Conference on Intelligent User Interfaces, 445–453 does something similar—assumes constant study time, searches for the most effective strategy.
The Pavlik paper makes fine distinctions in study time required when the interval is longer, or when the previous attempt failed. I don’t think this is the high-order bit. What really seems to matter is repetition count. How many times do I have to review this thing in a given period to reach a given stability?
2022-02-01 / 2022-02-02
Trying again to summarize what I know about the counter-factual situation. I can actually produce something like a density plot of estimated counter-factual forgetting up to 1 month. It doesn’t look that different from the plot without the practice at 1 day.
Comparisons (with practice for initially-forgotten vs. without):
- median: 82% vs 80%
- 25th %ile: 73% vs 70%
- 10th %ile: 66% vs 64% (10th %ile accuracy for initially-remembered is 69%)
Roughly consistent across readers. I’m finding myself skeptical that the effects of make-up practice are this small, given what we’ve seen elsewhere about the impact of practice.
One reason this data makes sense is that rates of initial forgetting are really pretty low. So having vs. not-having practice can only affect a small fraction of the resulting figure. And: as we look at lower-ability deciles, the recall rates for initially-remembered questions approach those of initially-forgotten questions (in part because we haven’t broken the latter down by reader decile).
So one theory here could be: maybe the recall rate for initially-forgotten questions would actually be much lower than 50% at one month, especially for lower percentile readers. Pushing the data from 20220119094651 for late people (probably unreasonably far), I see declines to 45 and 37% at 42 and 49 days respectively.
Are these late-practicers representative? I can try to assess that by comparing the in-essay accuracies of people reviewing forgotten questions with various delays to the prevailing in-essay accuracies. Here are median (IQR) in-essay accuracies among users reviewing forgotten questions at various delays (20220201092144):
- original schedule
- 0-3.5 days: 88% (79-93%)
- 3.5-10.5 days: 85% (77-91%)
- 10.5-17.5 days: 85% (76-91%)
- 5-day schedule
- 0-3.5 days: 87% (76-91%)
- 3.5-10.5 days: 86% (78-92%)
- 10.5-17.5 days: 85% (76-90%)
- 17.5-24.5 days: 83% (75-90%)
- 24.5-31.5 days: 84% (74-88%)
- 31.5-38.5 days: 82% (74-89%)
Maybe there’s a small effect here, but it’s not clearly all that pronounced. This pool of readers doing these reviews is skewed a few points from the prevailing pool—I’m not filtering by people collecting and completing reviews of 50+ cards, for instance—but it’s close enough that I’m not really going to fuss about the difference.
A thought: if I want more 2 month data, I could swap the %s around for new cohorts to emphasize that condition. Even tripling its prevalence, it’d probably take another year before I got solid data!
How much do people forget next-day? Quantum Country users seem to forget most prompts quite slowly suggests an accuracy of 89% at one day. I should compute scores from an equivalent pool of users to make a real comparison, but that gives me a taste.
So my counterfactual is that after a month, the median recall % is about 80%. 25th %ile is about 70%. This is probably an over-estimate, since we’re looking at relatively conscientious people. But the impact is not uniform: some questions suffer much more forgetting—e.g. 10% of cards have 60% or lower recall rates after 1 month.
Probably a better way to look at this is marginal forgetting. Compare one day to a month or two months.
…
Looking into most-forgotten question from 2020-01 Quantum Country efficacy experiment, curious how it compares vs. this one month forgetting data. The card is xiNW1zgeb2ITHGi6uQtg: “How can you write the $jk$th component of the matrix $M$, in terms of the Dirac notation and the unit vectors $|e_j\rangle$?”. s8duZcGBbu0dxb4xEAGg (“How can we express the squared length $|M |\psi \rangle |^2$ in terms of $M^\dagger M$?”) has almost the same forgetting rate. Both are 42% recall at one month without any support at all (i.e. without reviewing in-essay). They measure 76% and 79% respectively for the control group, which had a couple practice rounds.
So… how did those questions fare after 1 month with the new cohort? It’s a little hard to compare, since some readers remembered in-essay and some didn’t, so they’ll have different amounts of practice. For those who remembered in-essay, the 1-month-hence scores are 69% and 55% respectively. For those who forgot in-essay and got some extra practice, the scores are 84% and 63%; those are 50% and 44% of readers respectively. It’s interesting that extra practice seems to dominate the initial condition. That’s a good insight to follow up on… it’s probably true in general.
One question we can ask is: if those folks forgot in-essay and didn’t get extra practice, what might have happened? Looking at samples from people who simply reviewed late, we don’t really have enough data to say, but at two weeks, with a couple dozen users each, we see 32% and 49% respectively.
The control group numbers in the 2020-01 experiment seem surprisingly low to me: 76% and 79%? Really? Hm. In the 2021 1+3 week scenario, which is comparable, I see 59% and 71% respectively 20220201124331. OK, that squares. These cards clearly struggle with stability. It makes sense that their numbers in this new schedule would be lower than in the 2020 schedule, which would have an extra practice session.
Let me lift my head up here and summarize. For a couple “difficult” cards, recall rates after one month:
- with no support at all: 42% / 42%
- in-essay review (make-up sessions if necessary): 78% / 59%
- remembered in-essay: 75% / 52%
- forgot in-essay, got make-up sessions: 81% / 68% 50% / 43% of readers
- in-essay review (make-up sessions if necessary), practice at 1 week, sample at 3 weeks: 90% / 90%
- 2020 schedule (in-essay, 5 days, 2 weeks, sample at first review after 30 days of ingesting): 76% / 79%
And a few more, for good measure 20220202114355:
- in-essay review (with make-up sessions), sample at 1 week: 85% / 87%
- remembered in-essay: 81% / 83%
- forgot in-essay, got make-up sessions: 90% / 91% 44% / 50% of readers
- in-essay review (with make-up sessions), sample at 2 weeks: 76% / 86%
- remembered in-essay: 65% / 83%
- forgot in-essay, got make-up sessions: 94% / 88% 39% / 49% of readers
- unfortunately, only about 40 samples for each point here, so error bars are enormous
- Do these groups have substantially different “ability” levels? Can I use that to “explain” or “normalize” what I’m seeing? 20220202122723
- Eh… not really. The 2 week group does have a wider spread, but it’s hard to make a strong case here.
- eliminating the requirement for 50+ cards and a complete review, I get:
- 1 week: 82% / 87%; N = 72 / 70
- remembered in-essay: 76% / 84%
- forgot in-essay: 90% / 93% 52% / 49%
- 2 weeks: 75% / 82%; N = 68 / 61
- remembered in-essay: 73% / 85%
- forgot in-essay: 79% / 76% 35% / 34%
- 1 month: 71% / 68%; N = 58 / 71
- remembered in-essay: 65% / 65%
- forgot in-essay: 78% / 71% 47% / 44%
- 2 months: 67% / 65%; N = 51 / 54
- remembered in-essay: 63% / 72%
- forgot in-essay: 74% / 50% 37% / 33%
What about the “easiest” card from the 2021-01 experiment, h1AXHXVtsGKxkamS8Hb2, ($\langle \psi|$ is an example of a …)? It was remembered by 89% in that experiment without in-essay prompts or reviews (96% in the 2020 study with in-essay prompts and reviews). Current data 20220202131353:
- 1 week: 91% N=76
- 2 weeks: 84% N=64
- 1 month: 91% N=56
- 2 months: 100% (?!) N=43
- 1+3 weeks: 100% N=30 20220202131444
What about “lower ability” people? Say we look at the people who scored in the bottom quartile of in-essay accuracies (taking that threshold to be 83%, based on the 01-31 heuristic/data). In that case, I see what’s almost surely noise and survivorship bias: 78% / 64% / 93% / 100% for the four schedules; N = 9 / 11 / 14 / 5 respectively. Looking at the two harder cards, I get 75%/75%; 73%/75%; 62%/58%; 43%/44% for the four schedules. Only about ten samples for each, so not hugely persuasive. But maybe roughly indicative? 20220202153724
I’m a bit worried about the apparent discrepancies with the 2020 control group. Is this about the value of the 1-day make-up sessions? The 2020 control group had more practice in most(?) cases, but they scored worse! Hm… could those be because they were being tested one month after their 2 week session, i.e. at 7 weeks after reading? Looks like the median (IQR) delay is 22 (12-31) days and 21 (12-31) days. So I wonder why the performance is much worse than the 2021 schedule’s 1/3 weeks. Missing the 1-day make-ups? Looking at individual logs, I think that explains some of it, yes. These logs are, in general, pretty sloppy. One key generator of sloppiness here was the way that I decided to sample at one month—i.e. irrespective of when they’d last reviewed. So GyYpSKQ6pYfIHPf6xdK806nD6eR2, for instance, reviews on two adjacent days, because they’d happened to complete their most recent review on day 29 after enrolling.
2022-01-31
I’ve become increasingly interested since my call with Giacomo Randazzo in establishing some “truer” estimate of the QC counterfactual. The day-by-day data I’ve got in Quantum Country users who forget in-essay exhibit sharp forgetting curves gives a bleaker picture of recall for the subset of questions which are initially forgotten in the essay. And I think this data is also more representative because it’s less skewed by survivorship bias. Forgotten questions are reviewed first, so there’s less selection pressure on this data.
So, two related questions: leaving aside survivorship bias, how many questions do “real” readers forget in the essay? and: just how skewed is my practice data by survivorship bias?
I wonder if I can get some sense of the latter by trying to estimate the “ability” (in an IRT sense) of readers in these cohorts, and comparing those estimates to the initial performance while reading. One problem here will be that In-essay Quantum Country reader performance partially predicts first review performance—the correlation’s only about 0.5.
Had to use RStudio to plot this, since Google can’t do density plots. Felt so quick!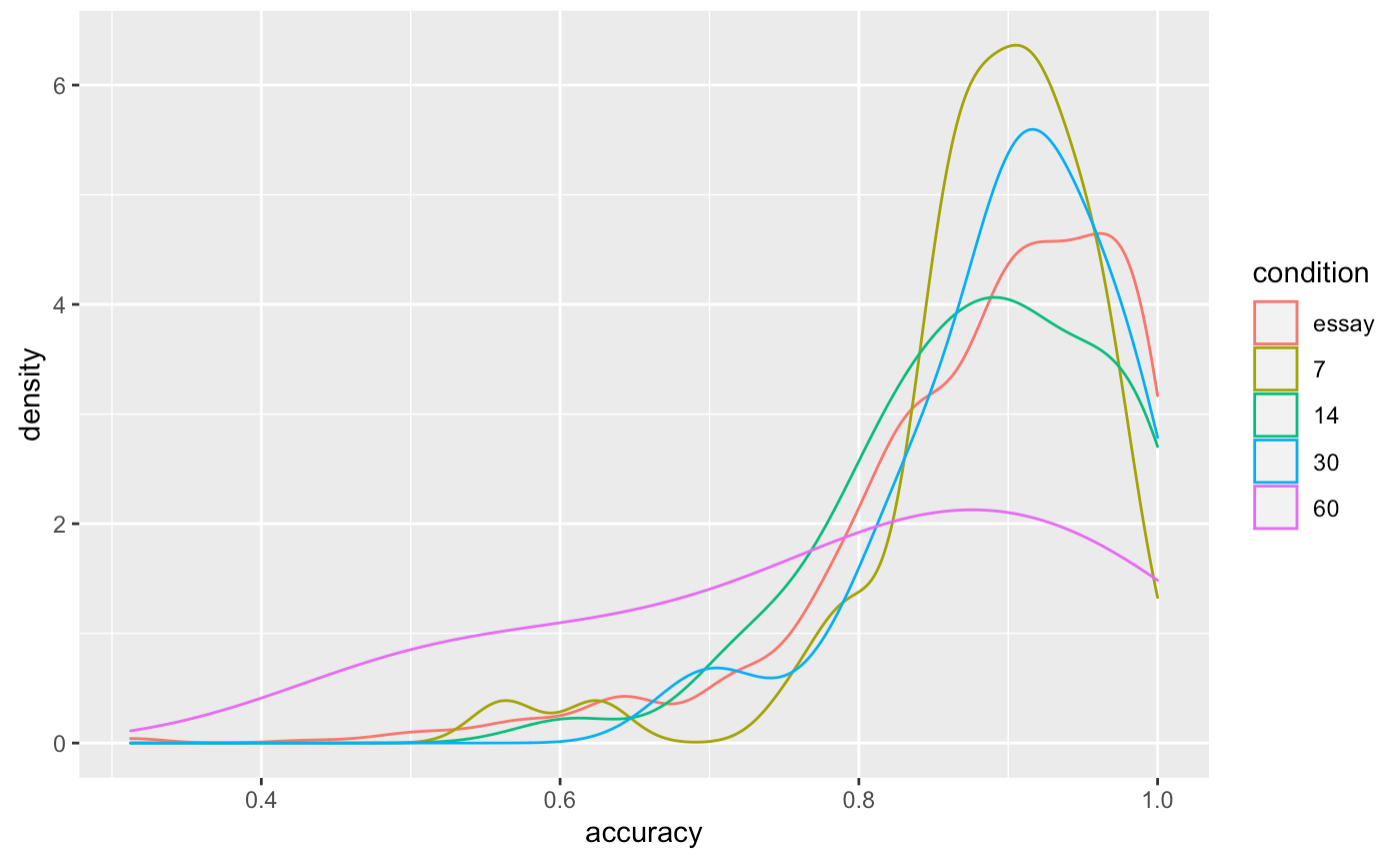
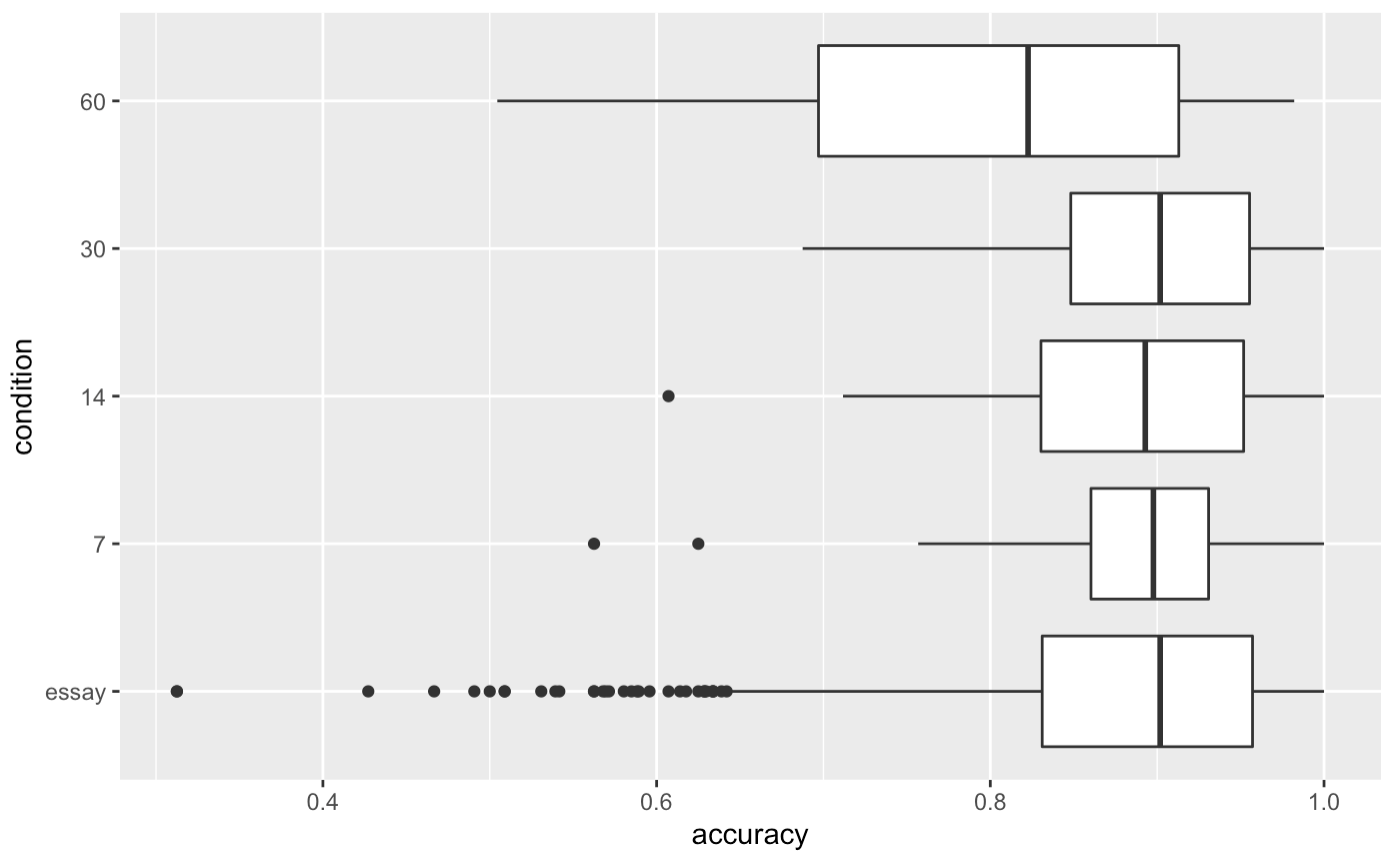
This is over people who collected at least 50 QCVC cards, and reviewed at least 95% of them. 20220131115743 What to make of this? n.b. this is 890 samples for essay, 50 for 7 and 14 days, 33 for 30 days, 6 for 60 days
I don’t make much of this, honestly. The distributions of in-essay performance of the subset of folks who actually complete a first review don’t seem all that skewed relative to the full set. At least for 7, 14, and 30 days, it looks like these are plausibly drawn from the same distribution as the in-essay set. Maybe not 14… but if anything, it’s actually left skewed relative to the essay. This suggests that in terms of “ability”, the numbers I’m looking at for folks who finished their first review are actually pretty representative of the whole. If I sample the median, or the 25th %ile reader in the 14 day condition who finished their first review, their in-essay accuracy will be pretty much the same as the median or 25th %ile reader without those constraints.
What I really want to know is: for various “typical” readers, how much should they expect to forget without review after, say, a month? Or, ideally, two months? The latter I don’t think I can answer—my sample is too small. But maybe I can approximate the former. The reader quantile plot from 2022-01-26 sort of shows this. But it’s the first delayed review, not the first actual review. So it understates the forgetting because the questions forgotten in-essay have received an extra round of practice.
Refining my reasoning from 01-26, let’s use queries for initially-remembered prompts for people who meet the same review criteria above (i.e. 50+ cards collected, 95%+ reviewed, 20220201083843). Now we find, at 1 month, 83% (74-91%; N=31). Doesn’t really change the estimate of 80% recall. Odd that this is only ~2pp below the figure below, which includes practice of the initially-forgotten prompts. 25th %ile is rougher: the estimate is ~70% recall without practice of initially-forgotten prompts. That’s about 3pp lower than the sample with practice of initially-forgotten prompts from 01-26.
I guess I still don’t really believe that I’m not seeing a skewed sample here. Hm… how could I convince myself?
2022-01-27
I realize now that my method for computing reader quantiles in QCVC questions are initially forgotten at very different rates was very wrong. Re-running, I see… well… confusion? 20220127162236 These don’t seem to line up with the graph from yesterday. Also, they don’t show any forgetting?
2022-01-26
First delayed review, sliced by reader rather than by card (among readers who collected >= 50 QCVC cards and completed first review of >= 95%):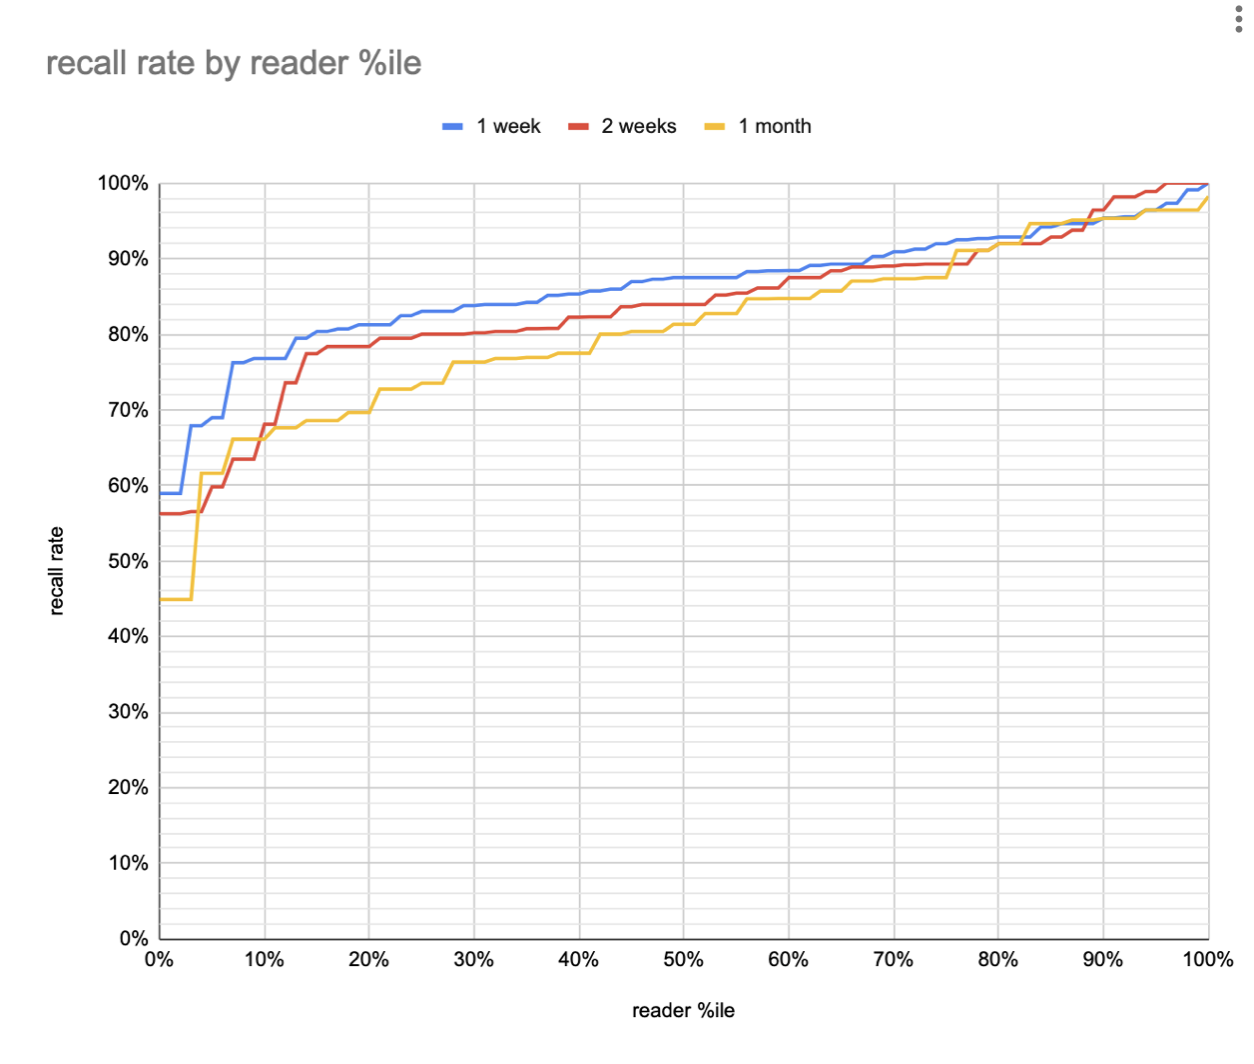
20220126164531 plot
So the median reader forgets a marginal ~8pp over the course of a month; the 25th forgets more like 10pp; 75th more like 5pp. But that’s with the make-up sessions’ reinforcement. This figure doesn’t really tell us about the true counterfactual—what would have happened without practice for a month. Can we see that somehow?
Looking at Quantum Country users who forget in-essay exhibit sharp forgetting curves, it seems that at one month, we should expect initially forgotten questions to have a roughly 50% recall rate. And per Quantum Country users seem to forget most prompts quite slowly, initially remembered prompts are at 84%. Median in-essay accuracy rates are around 90%, so we should expect median one-month recall rates (without make-up reviews) at around 80%. I find this pretty plausible.
25th %ile recall rates at 1 month are around 75% for initially-remembered (per 2021-10-11). Assuming (probably inappropriately) the same 50% recall rate for forgotten questions, and a 90% in-essay recall rate, we find a counterfactual recall rate of 53% at one month for the 25th %ile reader. I find this plausible too.
At the 75th %ile, they didn’t forget any questions in-text… that’s honestly just suspicious. Smells like To what extent do people “lie” when self-grading spaced repetition prompts? If we include only people who ~completed their first repetition, in-essay accuracy rates don’t change much. Median (IQR):
- 1 week: 90% (86-94%, N=34)
- 2 weeks: 87% (81-94%, N=34)
- 1 month: 90% (85-96%, N=23)
- 2 months: 84% (66-94%, N=5)
So anyway, very informally… 75th %ile recall rates at 1 month are ~95% (per 2021-10-11), so we should expect roughly a 93% counterfactual recall rate at 1 month for the 75th %ile reader. This is somewhat less plausible.
2022-01-20
Extending the (hand-wave-y, not really accurate) quantile analysis for 1/2+6 vs 8 weeks:
- % of readers above recall thresholds (1+3 vs 4; 1/2+6 vs 8 weeks):
- 50%+: 97% vs 85%; 95% vs 83%
- 75%+: 94% vs 73%; 86% vs 66%
- 90%+: 86% vs 60%; 78% vs 56%
- % of questions recalled, by reader quantile (1+3 vs 4; 1/2+6 vs 8 weeks):
- 10th %ile: 82% vs 37%; 66% vs 28%
- 25th %ile: 98% vs 72%; 93% vs 65%
- 50th %ile: 100% vs 95%; 100% vs 92%
Not sure I can make much out of this. It’s hard to distinguish the effect of the first session being 1 vs 2 weeks (i.e. lower starting encoding strength) and the effect of the second session being 6 vs 3 weeks out.
The big picture effect of practice is the same: across roughly the same period of eight weeks, a single session of practice makes an absolutely enormous difference in retention rates, particularly for lower-scoring readers and higher-difficulty questions.
30% more readers would get a C or higher on a test at this time; 39% more readers would get an A. Without practice, about half of students would get an A; with practice, about three quarters would. This discussion is all quite speculative, given the incomplete rosters of the second session samples and the strong selection / survivorship effects. But it’s directional, at least.
…
Looking now at the consequences of “make-up” session timing. Across different cohorts, we have:
- make up at 5 days (58%), then 2 weeks: 82%
- make up at 1 day (71%), then 2 weeks: 77%
Looks like this might represent a mild spacing effect?
Using only people who completed a full first delayed session:
- 5 days -> 2 weeks: 82% (6178 reviews, 484 users) 20220120104919
- 1 day -> 2 weeks: 78% (337 reviews, 28 users) 20220120104903
OK, so basically nothing happens to the effect.
Maybe this is because the 5 day users end up doing more practice before getting to 2 weeks, which would make the comparison unfair. Repetition count deciles:
- 5 days -> 2 weeks: 2 / 2 / 2 / 2 / 2 / 4 / 4/ 5 / 6 / 30 20220120105436
- 1 day -> 2 weeks: 2 / 2 / 2 / 2 / 2 / 2 / 2 / 3 / 3 / 6 20220120105634
Yes, this is a somewhat plausible explanation. Half of the users in the 5 -> 14 condition have 2 more repetitions under their belts. So let’s compare accuracies for only those users who remembered on their first make-up attempt.
- 5 days -> 2 weeks: 87% (3236 reviews, 461 users) 20220120110038
- 1 day -> 2 weeks: 78% (401 reviews, 78 users) 20220120105936
This makes sense, in hindsight. Because the 5 day recall rate is lower, this constraint selects for “easier” questions.
OK, well, then maybe the relevant statistic to look at is the expected number of repetitions to get to a given level of recall. This is multi-dimensional! Some users will get the best “scores” in this respect by using very long intervals. Others will need shorter intervals.
Alright, I think I need to look at the per-card plots for people who actually completed a first session, to really understand how things vary per-user.
…
Tried that 20220120165741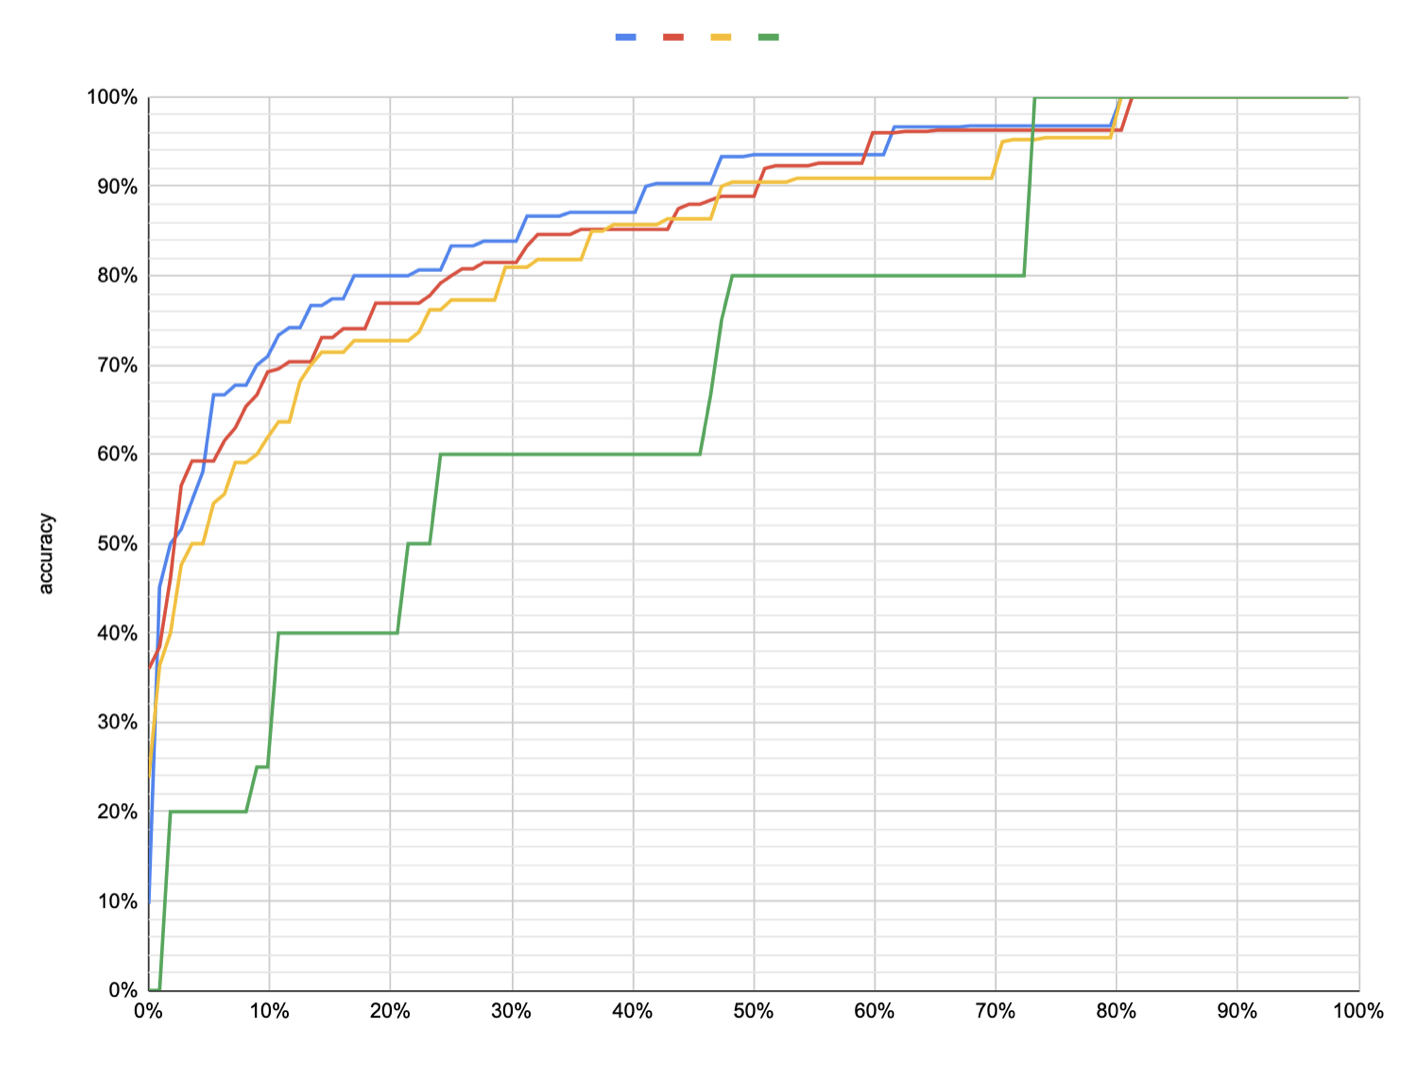
But we really don’t have enough data. The broad strokes here don’t look much different from what’s in QCVC questions are initially forgotten at very different rates, but it’s difficult to read much into this.
…
Looked into “why don’t the 2 month folks stick around”? Is there something wrong with the notifications? I don’t really see anything. 20220120170540
2022-01-19
Lots of analysis today in Quantum Country users who forget in-essay exhibit sharp forgetting curves.
How many initial 2-month reviews do we have? 2193 across 63 users (20220119122607). Hard to produce summary stats from that: an average of 35 reviews per user.
2022-01-18
On a whim I plotted 1/2+6 weeks on top of the 1+3 week per-card plot.
That’s pretty interesting. It suggests that forgetting is still a relevant factor in the second session. n.b. I only have 20-30 samples per card for that line.
Let me try to articulate my “so what” w.r.t. what I’ve learned from QCVC questions are initially forgotten at very different rates and these practice plots:
- We’ve roughly established the counterfactual. At least for roughly half of our users, if you don’t review, you’re likely to forget one-two thirds of the material by two months later.
- I need to get the “higher quality” version of this data, controlling the samples more accurately.
- I now actually have some metrics I can monitor and use to improve the efficacy of the system.
- For a large fraction of users and a large fraction of questions, frequent review really is unnecessary. The initial intervals can probably be quite high.
- Practice is the high-order bit, not getting the schedule exactly right.
Wrote:
- In-essay Quantum Country reader performance partially predicts first review performance
- In-essay Quantum Country question difficulties partially predict first review difficulties
- Longer initial intervals produce much lower completion rates (among 2021 QCVC readers)
2022-01-12
Continuing to look at per-question forgetting. I don’t know why I didn’t think to do this sooner, but here’s all four conditions: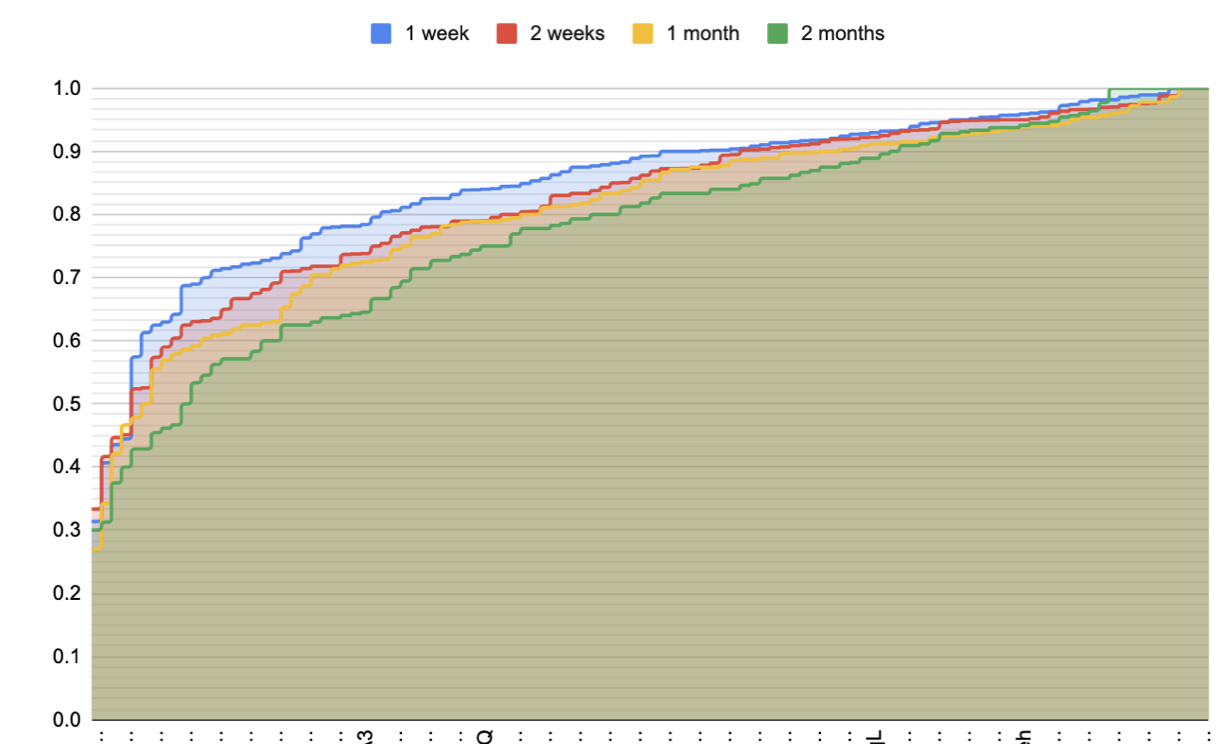
This is really quite interesting. The average forgetting delta between 1 week and 2 months is only 7%. But some questions experience much more forgetting. I’d say about a third of the questions exhibit substantial forgetting (15%); a third exhibit very little (2-3%); and a third exhibit moderate forgetting (8%). The positions of these segments are roughly consistent with an IRT model with the low-forgetting questions at the tails and the high-forgetting at the middle.
Another interesting way to look at this: at 1 week, roughly half the questions are recalled by 90% of readers; three quarters are recalled by 80% of readers. At 2 months, a quarter of questions are recalled by 90% of readers; half are recalled by 80% of readers.
Two take-aways here for me:
- As often happens, many “easy” questions end up flattening differences in more “critical” questions. When they’re removed from consideration, differences appear more clearly.
- I complained that I couldn’t see the counterfactual and that I don’t have a clear metric to guide future work. This seems to solve both. For many questions (though not many others!), 15%+ marginal forgetting is accrued between 1 week and 2 months; 10%+ is accrued between 1 and 4 weeks. Those numbers seem pretty plausible. I bet that if I break things down by quartile things get even clearer. Some reasonable metrics which emerge here are: for how many questions do 90% of people remember? What’s P_recall of the 10th %ile question? (here, roughly 56% vs 72%).
I summarized all this in QCVC questions are initially forgotten at very different rates
I think it’d be even more instructive to look at second session stats on this same plot. I can directly compare 1+3 vs. 4 weeks. 20220112091414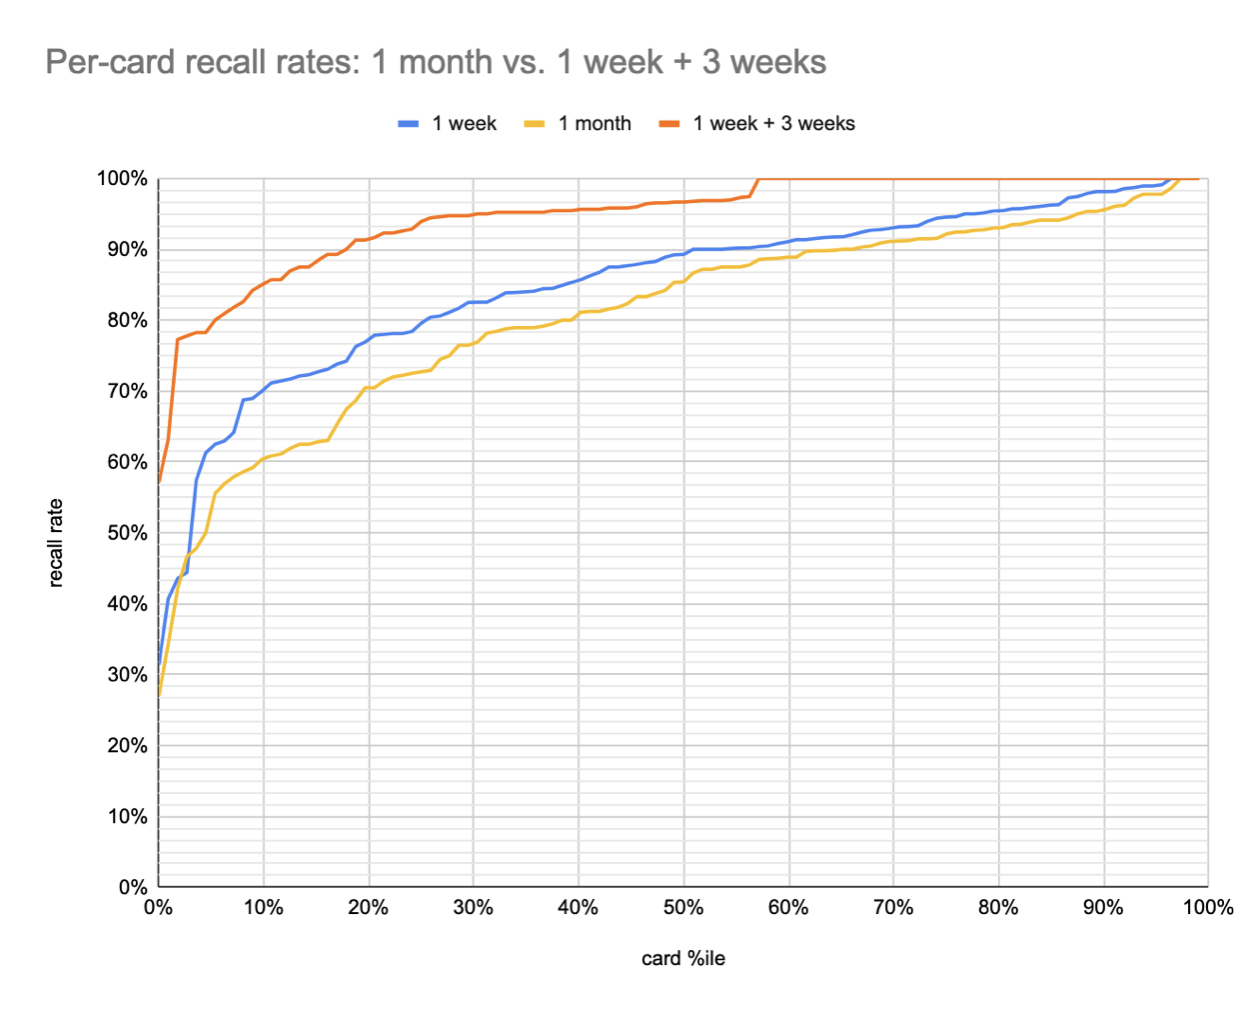
This tells a much better story. Suppose you want to remember the contents of this book one month later. If you review them at one week, you have a 90% chance of remembering ~80% of them; the 10th %ile question is recalled by 85% of readers. By contrast, if you simply wait one month, you have a 90% chance of remembering only about a third of them, the 10th %ile question is recalled by 61% of readers.
Some caveats here:
The 1+3 samples overstate the relevant recall rates in cases where the reader forgot at the 1 week point. In these cases, before attempting the 3 week interval, they try again after a 1 week interval, and proceed to the 3 week interval only once successful. This both falsely inflates the data (more practice) and also probably skews the samples up, since I expect some users bailed before getting to the 3 week point.
The 1+3 readers are doing more review sessions, which skews the sample more conscientious.
% of readers above recall thresholds (1+3 vs 4 weeks):
- 50%+: 96% vs 85%
- 75%+: 94% vs 73%
- 90%+: 86% vs 60%
% of questions recalled, by reader quantile (1+3 vs 4 weeks):
- 10th %ile: 82% vs 37%
- 25th %ile: 95% vs 72%
- 50th %ile: 100% vs 95%
2022-01-11
Looking into whether forgetting curves are consistently much steeper for bottom-quartile users.
First off, here are in-essay accuracies by user, among 2021-04 Quantum Country schedule experiment readers who collected at least 80 QCVC cards and completed a delayed review of them all, in-essay accuracies 20220111061948 are 90% (85-96%, N=87).
Note that when I remove these conditions—looking at all users, irrespective of how many prompts they collected or whether they reviewed any of them later—I see 89% (81-95%, N=890). So there’s not apparently that much selection pressure in my much smaller sample.
Bottom quartile (in-essay) accuracies at first delayed repetition: 83% / 78% / 77% at 1 / 2 / 4 weeks, with a user count of 8, 10, and 4 respectively 20220111063752. If I remove the constraint that the user has completed their first review (still requiring 80+ cards collected), I see 79% / 79% / 75% / 72% with 20 / 25 / 17 / 8 users. If I remove the 80+ card requirement, I see 80% / 79% / 74% / 71% with 40 / 45 / 29 / 12 users. Note that this downward skew supports the hypothesis of survivorship bias I’ve articulated a number of times when looking at long-lasting QC accounts.
So the bottom quartile forgets roughly a quarter of the material a month after doing the in-essay reviews (but forgets about half that much as soon as 1 week later). This still seems like a pretty small amount of forgetting to me, considering that we’re talking about the bottom quartile, but it’s maybe in the realm of plausibility, given the survivorship bias involved in this sample.
Combining the second and third quartiles, I see 88% / 84% / 86% / 83% with 50 / 38 / 26 / 22 users. So it really does seem to be true that the bottom quartile has a steeper forgetting curve. The fourth quartile is 91% / 91% / 87% / 83% with 17 / 21 / 14 / 11 users.

Here’s 1 week (blue) vs. 1 month (red) per-card QCVC accuracies. Top image sorts each by accuracy within the cohort (and so each position on the X axis isn’t necessarily the same card); bottom image aligns 1 month data to 1 week x axis. 20220112085959
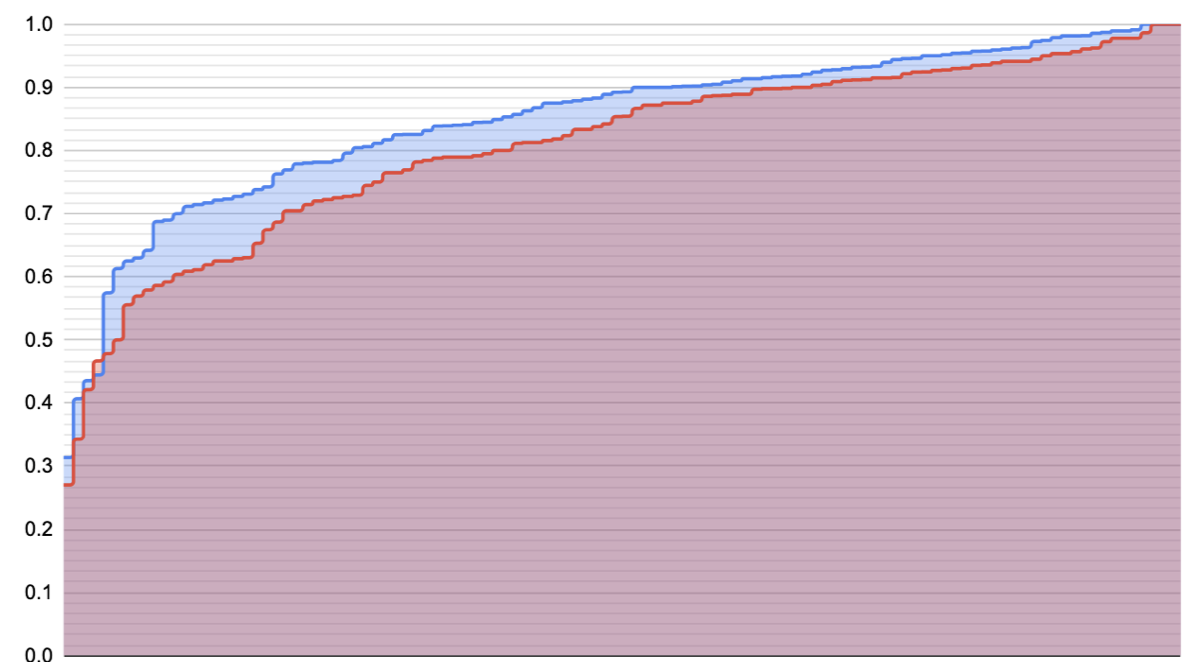
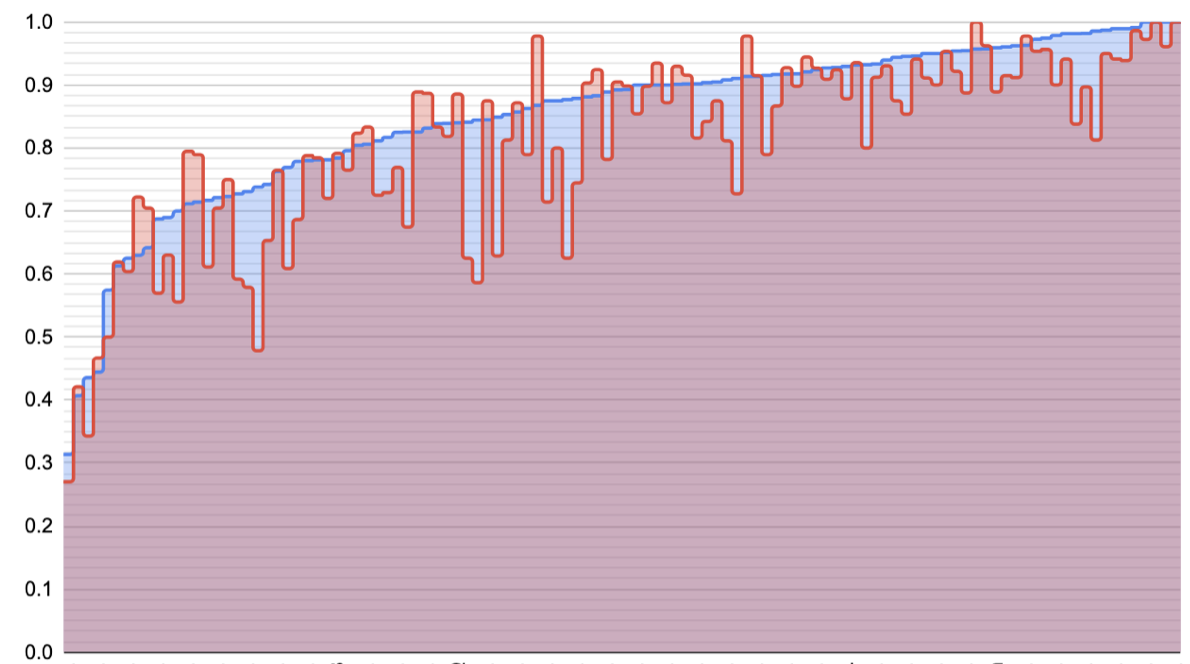
What do I see here?
- I certainly don’t see a sigmoid, like I’d drawn. Maybe there’s a left tail five prompts long or something, but that’d be the extent of it. More just a cratering on the left edge.
- Ah: but I shouldn’t see a sigmoid. The sigmoid describes the probability, not the expected sample. If the true probability of the “easy questions” is 0.8, and I draw 100 samples, the 95% range extends 8% to either side. We see that noise echoed in the bottom plot.
- This also (maybe) explains the more or less linear growth in accuracy for much of the entire set of cards.
- Roughly half of the questions are in a part of the curve where the delta is only about 2%. In IRT terms, they’d be on the saturated right edge of the sigmoid. That sounds pretty plausible to me.
- Roughly speaking, as difficulty increases, so does the delta between the conditions. This is also consistent with an IRT-like model.
- I’m not sure what’s going on with the left edge. One story is that this point we’re in the saturated left leg of the IRT plot for most ability levels. Another story is that sampling variance will increase for these values close to 50%.
Indeed: the slopes we see here can be explained by quite a simple model. Assume IRT: accuracy varies with the logistic of a question’s difficulty. Then here’s a plot which draws a similar sample to the live ones above, assuming a stupid simple two-level difficulty model (i.e. “there are a few quite hard questions; almost all the rest are pretty easy”).
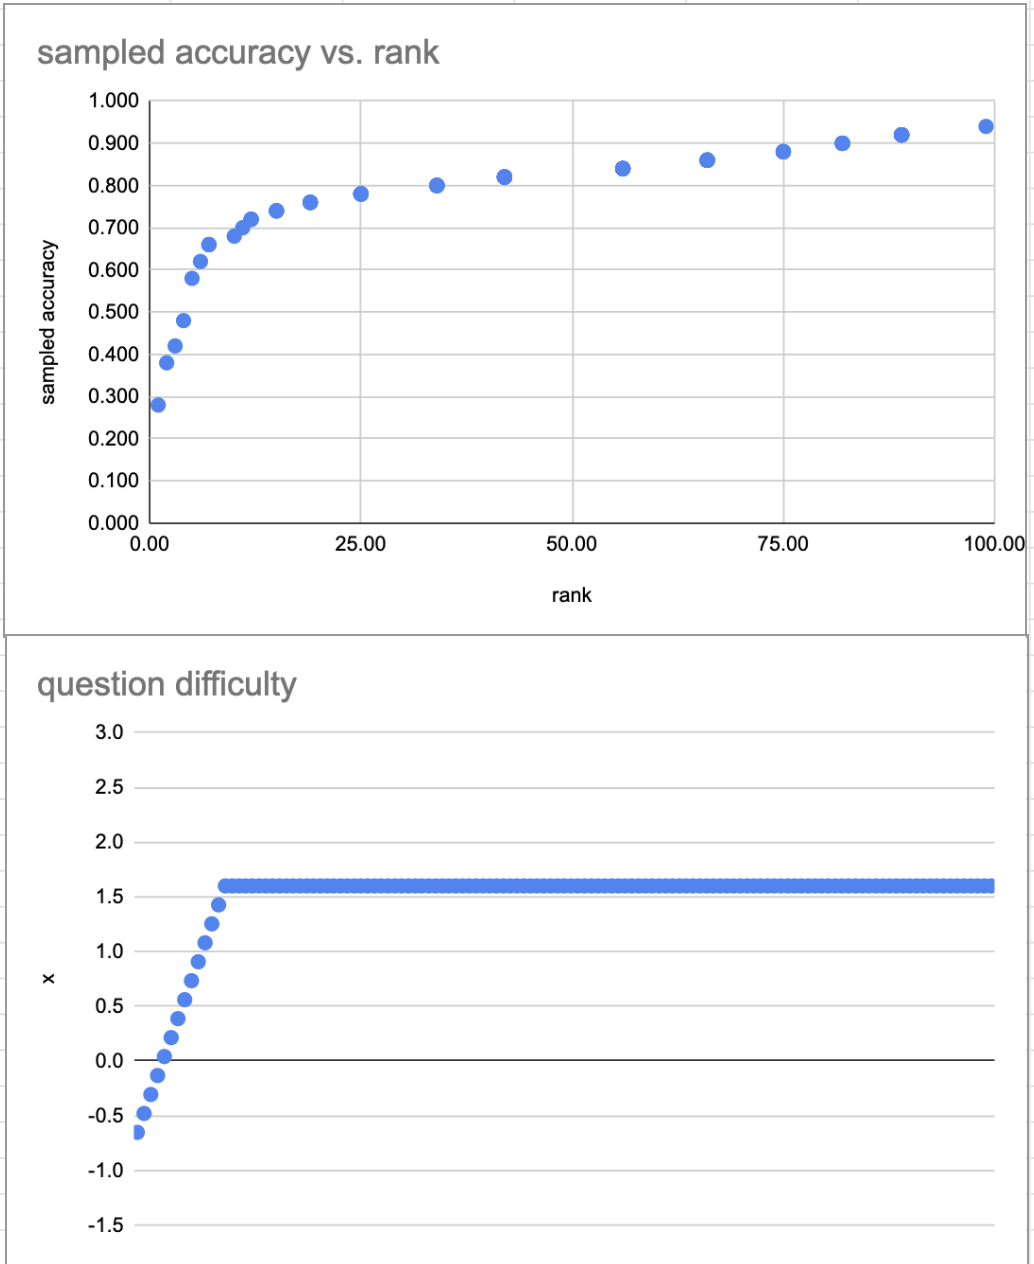
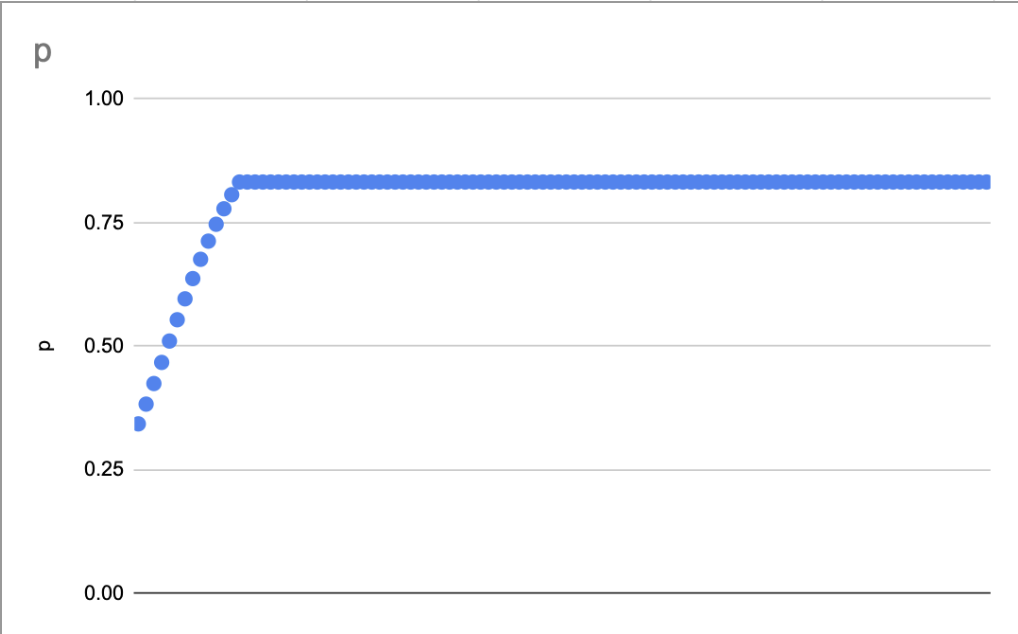
Struggling with the “so what”… this doesn’t quite seem to support my notion that there are questions which are so easy that a decline doesn’t shift the distribution much, and some which are likewise so hard.
2022-01-10
A very quick look at response times by delay interval suggests no relationship (median seconds (IQR)) 20220110105021:
- 5 days: 9 (6-16)
- 1 week: 9 (6-16)
- 2 weeks: 9 (5-16)
- 1 month: 9 (6-17)
- 2 months: 9 (6-15)
Each with thousands or tens of thousands of data points. Boy, this really doesn’t make sense!
But maybe if I break it down by card or ability or prior recall or whatever…
2022-01-07
Updated first delayed repetition in QCVC, for readers who have collected at least 50 questions and answered at least 90% of those they collected 20211130174228:
- 1 week: 87% (82-92%, N=46)
- 2 weeks: 85% (81-90%, N=41)
- 1 month: 85% (74-92%, N=27)
- 2 months: 70% (61-79%, ==N=5==)
2021-12-16
Got interested in how much variability seems to be explained just by question difficulty and reader proficiency.
Ran a simple IRT model on in-essay data (20211216124546), put it through py-irt; got an 86% AUC: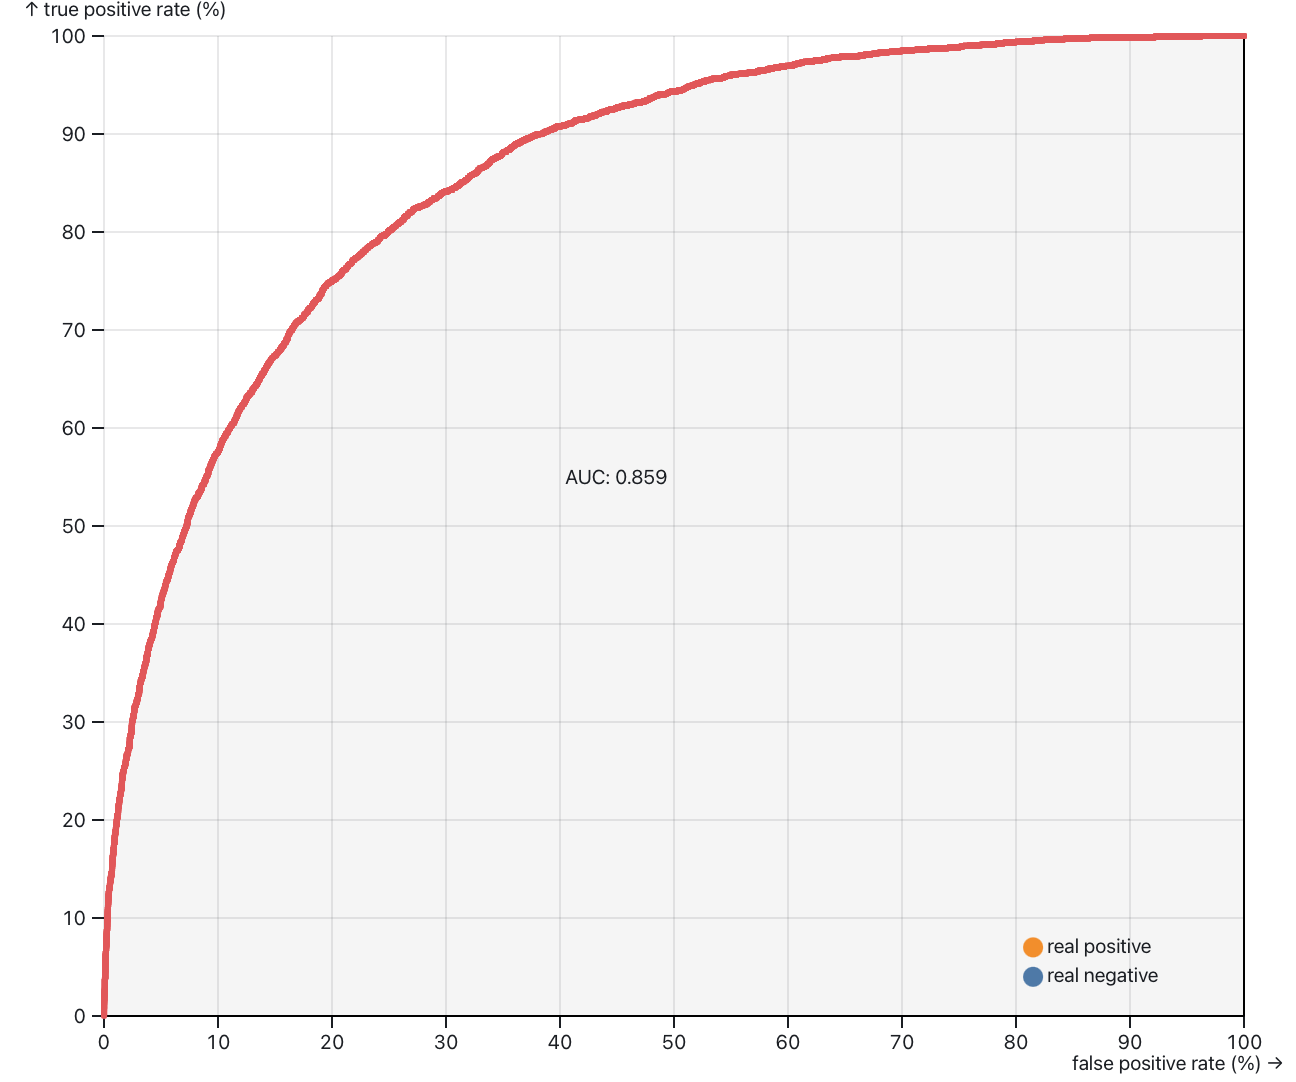
Interpreting this… say that we want to catch 90% of the instances in which a student would have forgotten (i.e. a 10% false positive rate). The corresponding point on the vertical axis is roughly a 60% true positive rate, i.e. in 40% of the instances in which a student did remember the answer, we’d assign the question anyway.
The ratio of remembering to forgetting is roughly 7:1. So this means for 112 questions in QC, we’d make you review 39 you could answer correctly, make you review 12 you would have forgotten, and miss ~1 you’d forget. i.e. this isn’t very predictive!
Tried to use this IRT model to make predictions about the first review session (20211216160434), but running into issues with py-irt. Don’t feel like debugging it now; I don’t have a clear enough grasp on why I’m doing what Im’ doing.
2021-11-30
Updated first delayed repetition in QCVC, for readers who have collected at least 50 questions and answered at least 90% of those they collected 20211130174228:
- 1 week: 87% (81-92%, N=35)
- 2 weeks: 87% (81-91%, N=35)
- 1 month: 85% (77-92%, N=25)
Lumping all reviews in each condition into one big bucket and looking at that accuracy rate 20211130174838:
- 1 week: 86% (N=138 readers, 6381 reviews)
- 2 weeks: 84% (N=142 readers, 6319 reviews)
- 1 month: 83% (N=90 readers, 4477 reviews)
- 2 months: 81% (N=50 readers, 1744 reviews)
Looking at original-schedule users for 1 day:
- 1 day: 87% (N=258 readers, 6433 reviews)
In-essay accuracy for people who complete a first review: 93-95% across the board (20211130195455). 90% at 25th %ile, 100% at 75th %ile. 20220127110154
2021-11-26
Some more happy-path second session analysis, through an unprincipled across all schedules 20211126111544:
- 1 day -> 1 day (97 readers, 196 reviews): 90%
- 1 day -> 3 days (1441 readers, 73515 reviews): 97%
- 1 day -> 5 days (39 readers, 634 reviews): 97%
- 1 day -> 7 days (80 readers, 939 reviews): 96%
- 3 days -> 7 days (216 readers, 2260 reviews): 96%
- 3 days -> 14 days (8 readers, 252 reviews): 97%
- 7 days -> 14 days (20 readers, 222 reviews): 96%
- 7 days -> 21 days (37 readers, 1420 reviews): 96%
- 7 days -> 42 days (10 readers, 447 reviews): 93%
- 5 days -> 14 days (2090 readers, 89140 reviews): 95%
- 5 days -> 31 days (112 readers, 803 reviews): 96%
- 5 days -> 62 days (11 readers, 110 reviews): 97%
- 14 days -> 31 days (208 readers, 2023 reviews): 97%
- 30 days -> 90 days (16 readers, 326 reviews): 96%
- 31 days -> 62 days (18 readers, 204 reviews): 97%
Pretty much totally flat, I’d say. No real Spacing effect here, either, as far as I can see, though most of these pairs aren’t directly comparable. They’re also not generally comparable because most of these pairs (the ones not logged in the Quantum Country users seem to forget most prompts quite slowly) involve users whose schedules varied per-question rather than per-user, so there’s lots of likely inter-card interference.
And now looking at third sessions, remembered in-essay and in the first two sessions 20211126112016:
- 1 -> 3 -> 7 (967 / 51975): 98%
- 1 -> 3 -> 14 (39 / 1107): 97%
- 1 -> 5 -> 14 (19 / 322): 98%
- 1 -> 7 -> 14 (54 / 590): 97%
- 3 -> 7 -> 14 (157 / 1617): 98%
- 5 -> 14 -> 31 (1062 / 42850): 97%
- 5 -> 14 -> 62 (30 / 336): 98%
- 5 -> 31 -> 62 (60 / 414): 97%
- 14 -> 31 -> 62 (100 / 1097): 97%
Welp, alright! Nothing to see here, really. This is a natural consequence of Quantum Country users rarely forget after demonstrating five-day retention.
Another interesting question to ask, which might more clearly reveal the trouble for longer delays: how many repetitions necessary before the first successful repetition after a delay?
Because there’s so little forgetting going on, it doesn’t really seem to matter. 20211126122806
Let me try asking this aggregating by user. For users who eventually recall >= 100 cards after a delay, how many total reviews does it take? Null result here… though I can’t shake the feeling that I’m not asking this correctly. 20211126124426
2021-11-22 / 2021-11-23
Continuing my analysis of the compounding effects of the forgetting curve.
I find myself wanting to produce something like the “forking paths” diagram I’d made earlier this year. I’ll combine the people in the A and AX etc cohorts.
First session accuracies (1 day later) 20211122100841, across the four conditions which will follow:
- 1 week (162 readers, 1287 reviews): 72%
- 2 weeks (165 readers, 1174 reviews): 73%
- 1 month (154 readers, 1159 reviews): 67%
- 2 months (172 readers, 1349 reviews): 68%
This variation should be entirely noise. It’s discouraging that I see a slight downward trend here because I know it’s noise, and yet I’m still seeing a downward slope with a lot more samples than my other results. As far as I can tell, looking at the raw samples, it really is noise. This really calls into question the rest of my analysis. But I suppose at least we can look at what happens next. Update: the noise collapsed after I resolved the bug described a few paragraphs down. A 6% spread is not that unreasonable: the 95% confidence interval for any of these samples is roughly ±3% assuming these reviews are binomial iid.
Second session accuracies (assuming remembered in first session) 20211123090637:
- 1 week (75 readers, 451 reviews): 85%
- 2 weeks (65 readers, 300 reviews): 78%
- 1 month (55 readers, 254 reviews): 70%
- 2 months (26 readers, 95 reviews): 56%
Trying to explain the noise I see in the first-session results, I dug into the actual experimental groups behind each of these… and now I’m very confused. The 2-week group contains a handful of A, C, and D folks too. What the heck??
Alright. There were bugs. Particularly at the beginning, it seems. And… older users are being opted into the new schedules. Blugh. I’m going to have to constrain these results much more carefully. Constraining to the actual expected beforeIntervals seems to be sufficient.
Third session accuracies, by second session latency, assuming forgotten in second session (one day later) 20211123103658:
- 1 week (31 readers, 79 reviews): 90%
- 2 weeks (33 readers, 86 reviews): 78%
- 1 month (24 readers, 70 reviews): 83%
- 2 months (9 readers, 44 reviews): 57%
Third session accuracies, by second session latency, assuming remembered in second session 20211123104202:
- 1 week -> 3 weeks (22 readers, 127 reviews): 89%
- 1 week -> 6 weeks (7 readers, 56 reviews): 71%
- 2 weeks -> 6 weeks (18 readers, 82 reviews): 98%
These seem to demonstrate the Spacing effect—first time I’ve seen that in Quantum Country data. Not many samples, though.
Another way to put this, which emphasizes the compounding nature of late scheduling: how often do people forget both in the delayed recall test and in the following recovery session?
- 1 week: 1%
- 2 weeks: 5%
- 1 month: 5%
- 2 months: 19%
Very casual attempt to plot this data here.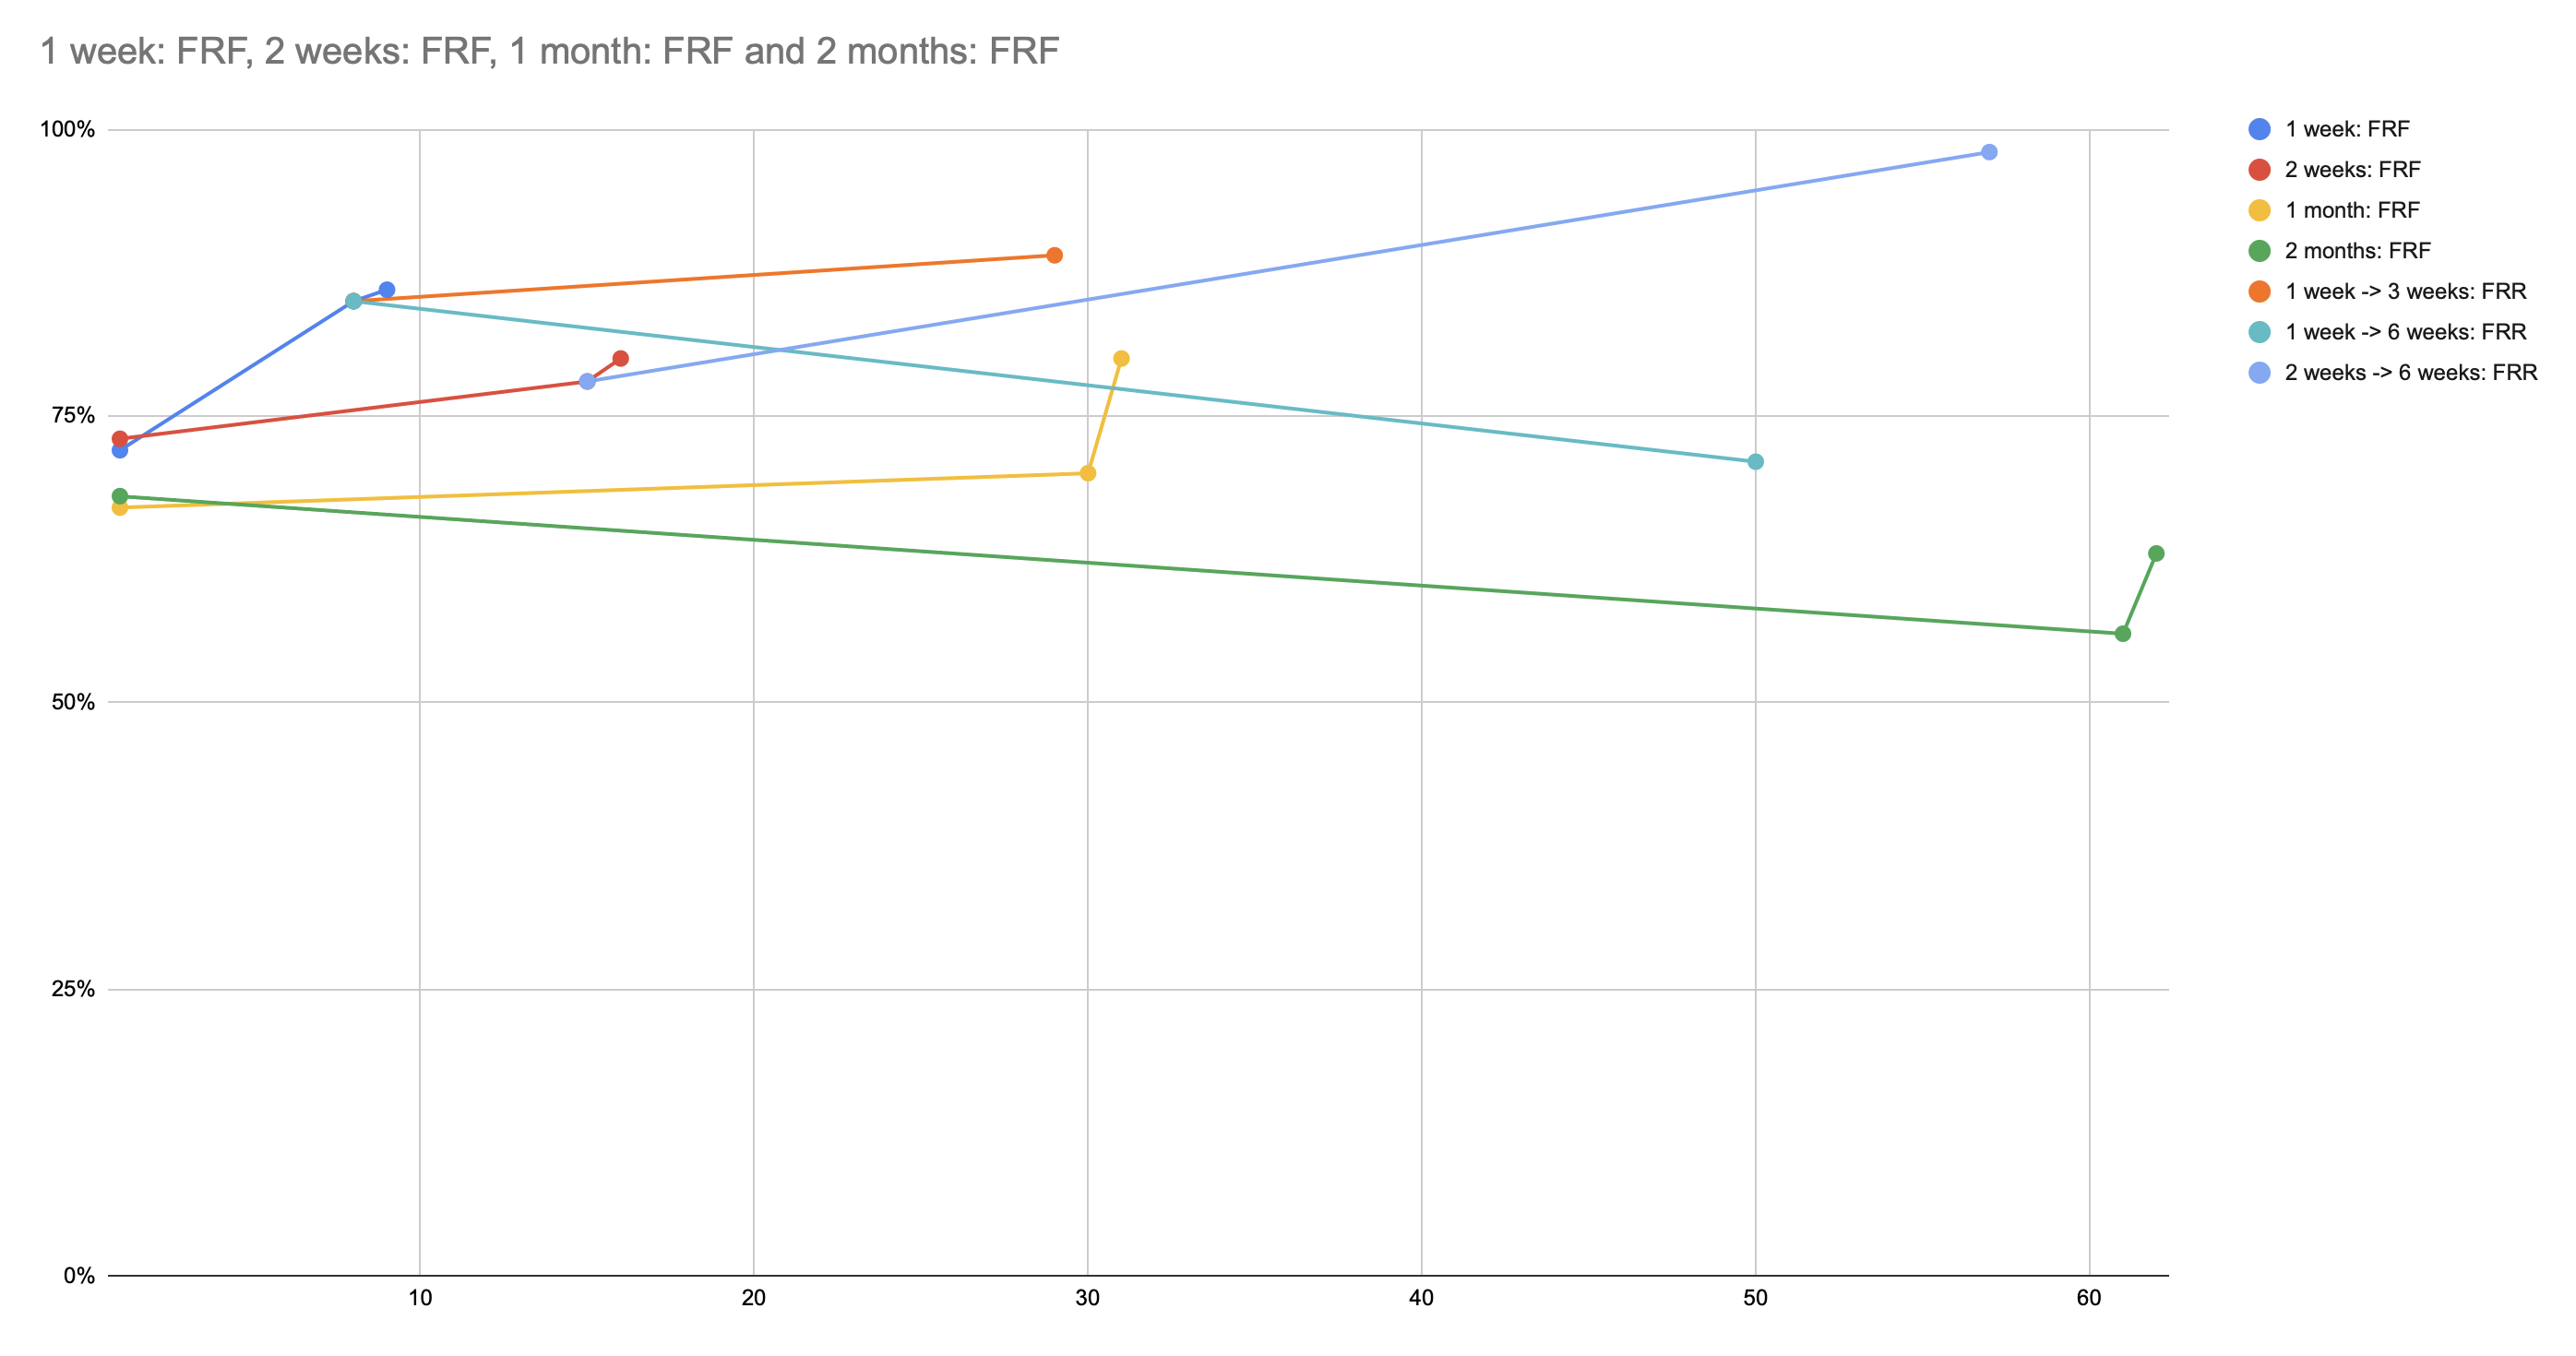
Repeating my analysis of remembered -> forgotten prompt recovery rates (20211123163958):
- 1 week (68 readers, 600 reviews): 84%
- 2 weeks (66 readers, 529 reviews): 81%
- 1 month (44 readers, 384 reviews): 85%
- 2 months (16 readers, 147 reviews): 74%
Pretty much the same as I got a few days ago… but I find it more interesting today. The endpoints are far enough apart to suggest a real effect.
And now, what about a fourth session, assuming forgotten in second and recalled in third? Eh… not really enough data for me to believe it. 20211123165933
Now looking at “happy path” traces (remembered in essay and in first review) 20211123171811:
- 1 week -> 3 weeks (37 readers, 1420 reviews): 96%
- 1 week -> 6 weeks (10 readers, 447 reviews: 93%
- 2 weeks -> 6 weeks (38 readers, 1205 reviews): 94%
- 1 month -> 3 months (16 readers, 326 reviews): 96%
Pretty amazing… no real diffs here! And not much demonstration of the Spacing effect.
Extending to aggressiveStart users 20211124102352:
- 5 days -> 14 days: 95%
- 5 days -> 1 month: 97%
2021-11-18
I realized late last night that if I want to see the impact of scheduling “too late”, I really should be looking at comparisons where the accuracies at the point of forgetting are quite disparate. So modifying yesterday’s query to look at questions which are:
- forgotten in-essay
- remembered in some “recovery” review session afterwards
- forgotten in the first “real” review session, after that
- … then reviewed one day later.
Inconclusive, but perhaps suggests a downwards trend.
- 1 week (31 readers, 75 reviews): 89%
- 2 weeks (33 readers, 83 reviews): 67%
- 1 month (20 readers, 62 reviews): 81%
- 2 months (8 readers, 43 reviews): 56%
A 5 days data point shows… 53%? I don’t understand what’s up with these users and why they’re so different. Can it be the stupid 1729 thing? Let me try excluding that data. Nope. Not sure what’s going on here.
OK… it looks like the behavior actually used to be:
- forget a prompt in-essay, then retry: it’s at 5 days
- remember at 5 days: now it’s 2 weeks
And so in the results I’m seeing for aggressiveStart which list both 5 and 14 days, the 5-day people forgot again in their first review session. (I wonder if this explains the weirdly-low 5-day numbers I was seeing the past couple days?)
Refining, for aggressiveStart:
- forgotten in-essay
- remembered in first session (5 days later)
- forgotten in second session (2 weeks later)
- … third session? (5 days later)
20211118111432: 74% (510 readers, 949 reviews)
For original (but n.b. they had no retry!… so not really comparable):
- forgotten in-essay
- remembered in first session (1 day later)
- forgotten in second session (1 day later)
- … third session? (1 day later)
20211118111922: 71% (420 readers, 671 reviews)
This suggests that the impact of retry is greater than the impact of scheduling.
Now looking again at the recent experimental groups, which will have the form:
- forgotten in-essay
- remembered in first session (1 day later)
- forgotten in second session (X days later)
- … third session? (1 day later)
- 1 week (30 readers, 59 reviews): 86%
- 2 weeks (30 readers, 53 reviews): 70%
- 1 month (18 readers, 47 reviews): 81%
- 2 months (8 readers, 30 reviews): 63%
Certainly suggests a causal downwards trend. What I take from this: Retrieval practice, even when repeating the question until it’s remembered, does not fully compensate for forgetting. If you’re going to forget, it’s best to do the retrieval practice as soon as possible.
Amusing: there’s some very weak evidence here for the Spacing effect, comparing to the aggressiveStart data, in which the first session is 5 days (74%), vs. 1 day (70%) in this instance.
I should expect to see this effect anywhere I can measure a real forgetting curve. So I should see it also for “hard” cards forgotten in the first session. But I don’t, really! I see 85 / 85 / 85 / 67%. 20211118121112. < 50 data points per category; 21 for 2 months. Hm.
I tried just repeating the query from 11/16 with this analysis… and I’m getting fewer samples and add flatter curve: 74 / 69 / 65 / 62. Gotta understand why. Oh! I’m pretty sure it’s because I’m only including instances where it was remembered initially. Yep!
2021-11-17
OK. Let’s look at accuracy among users of 2021-04 Quantum Country schedule experiment for questions which are:
- remembered in-essay
- forgotten in first session (X days later)
- … then reviewed one day later.
Looks like a null result. 20211117184120
- 1 week (68 readers; 600 reviews): 84%
- 2 weeks (63 readers; 496 reviews): 82%
- 1 month (43 readers; 379 reviews): 85%
- 2 months (16 readers; 147 reviews): 74%
…but you know, it makes sense that this would be a null result. We measured very little forgetting curve in this case anyway: questions remembered in essay are forgotten surprisingly slowly.
2021-11-16
Thinking again about 2021-04 Quantum Country schedule experiment. Following up on the stats from last time…
First, first repetition accuracies across users who collected all prompts:
- 2021-04-A (1 week, N=25): 79% / 86% / 92%
- 2021-04-B (2 weeks, N=22): 77% / 87% / 92%
- 2021-04-C (1 month, N=13): 70% / 85% / 95%
- (not enough for D)
Averaging across all responses, for prompts forgotten during initial read (20211011120323):
- 1 week (79 readers, 626 reviews): 84%
- 2 weeks (73 readers, 447 reviews): 77%
- 1 month (57 readers, 341 reviews): 69%
- 2 months (27 readers, 138 reviews): 56%
Basically the same as a month ago, with a chunk more data.
The trouble with those first numbers is that they’re mixing in the next-day reviews for forgotten prompts, which will damp out variation. So, adapting that last query to include questions which were remembered initially:
- 1 week (131 readers, 6476 reviews): 85%
- 2 weeks (133 readers, 5642 reviews): 84%
- 1 month (87 readers, 4302 reviews): 82%
- 2 months (46 readers, 1609 reviews): 80%
For the hardest ten questions, in terms of in-essay accuracy (20211116152859):
- 1 week (76 readers, 420 reviews): 77%
- 2 weeks (61 readers, 338 reviews): 69%
- 1 month (51 readers, 291 reviews): 64%
- 2 months (28 readers, 118 reviews): 57%
Aha! A real curve. Worth noting that many of these respondents got an extra repetition in (because of the post-forgetting review).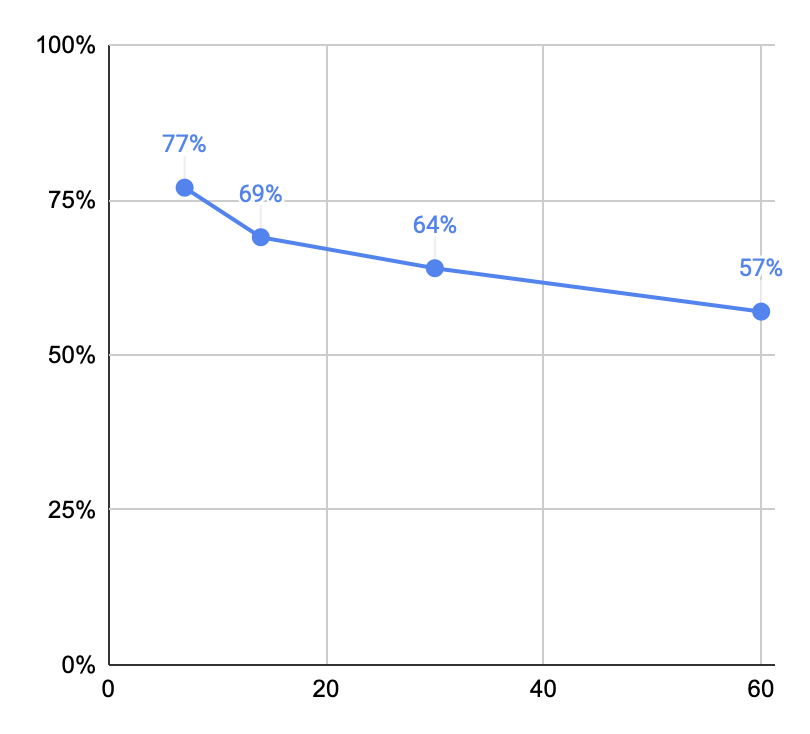
And for the easiest ten (20211116163825):
- 1 week (115 readers, 681 reviews): 95%
- 2 weeks (120 readers, 649 reviews): 95%
- 1 month (77 readers, 443 reviews): 95%
- 2 months (42 readers, 181 reviews): 93%
Basically flat forgetting. Right. So for these questions, we might as well push the first reviews out for months.
Well, maybe. Interestingly, the “easiest” question is
‘After we measure a state $\alpha|0\rangle+\beta|1\rangle$ in the computational basis, is it still in the state $\alpha|0\rangle+\beta|1\rangle$?
It’s worth asking: is retrieval practice really the purpose of this question? Or is it more that these are Salience prompts? Is it a “reminder”—i.e. hey dummy, measurement is destructive! Here’s another theory: the phrasing of this question may cue successful retrieval… but if we’d asked some other question which only incidentally required this knowledge, we might see quite a lot of variation in memory. I suppose this comes back to Retrieval practice and transfer learning.
We can measure, per-question, the size of the delta between the first and last. 20211116172650 Hm… only 40 samples or so per question. Pretty noisy, though 3/4 of questions decline over time.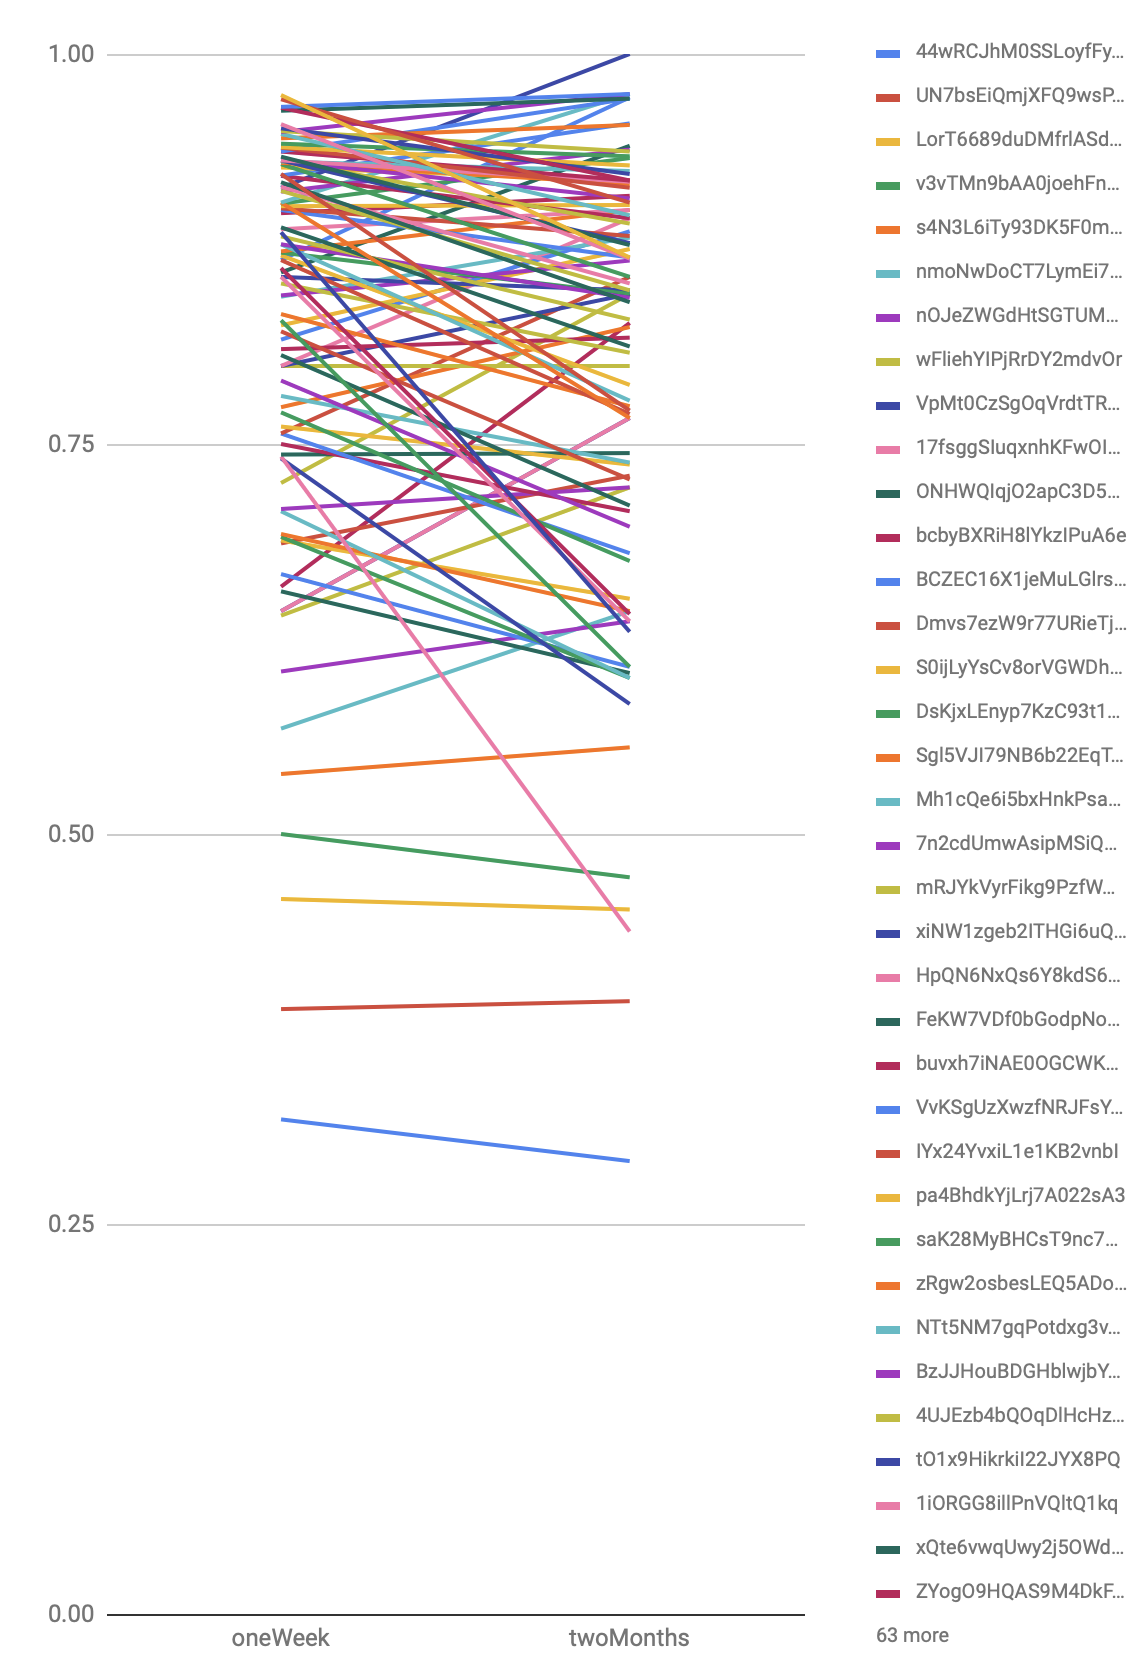
I wonder if the bottom questions here are so flat because those questions are so extreme that they’re mostly measuring reader properties (prior knowledge, reading diligence), rather than incremental forgetting-over-time.
Does this get clearer if I filter on initial success? Not really.
I thought: maybe I can use the original schedule data to get an extra data point at 1 day for these hard prompts. Interestingly, that also shows 78%. And… 5 days shows 56%?! I think something odd is going on there—I don’t believe that number.
Likewise looking at the original schedule across all prompts at first repetition, we see an accuracy of 89% at one day and 82% at five (again, an odd dip here) 20211116182507. So, roughly, from 90% to 80% across two months. Wild. And for the easiest ten prompts, we see 96% at one day and 95% at five days 20211116182559. Almost no drop across the two month period.
How rapidly does this effect disappear? Taking cards in difficulty 10-20 (again in terms of accuracy at first essay), I see 20211116182921:
- 1 day: 81%
- 5 days: 69% (again… I don’t trust this)
- 1 week: 74%
- 2 weeks: 79%
- 1 month: 72%
- 2 months: 71%
I’d describe this as the effect mostly disappearing for these prompts.
How sensitive is this to my choice of in-essay “hardest” ranking? Taking the ten lowest accuracies at first review, I get 20211116183103:
- 1 day: 62%
- 5 days: 45% (again, I don’t trust this)
- 7 days: 58%
- 2 weeks: 58%
- 1 month: 54%
- 2 months: 44%
OK, so a pretty similar decline, albeit starting from a much lower position.
Arguably, the interval isn’t really what matters here. Waiting an extra month and a half lowers accuracy by 14%… that’s like one and a half fewer questions remembered on average. Not a big difference at all. The big effect here, really, is repetition! Maybe it really doesn’t matter so much when you review—just that you review. Or, well, that’s a hypothesis.
So another way to look at these schedules is: you’re trying to get to the point where you have a 90% chance of actually remembering the answer to the question…
Just realized I can use the same method to look at forgetting rates for original schedule users on originally-forgotten prompts at 1 day: 89%. So we have 89% falling to 56% two months later. OK. Solid. 20211116190100 Interestingly, I see 89% for prompts remembered in-essay, too 20211116190541. So these curves converge at 1 day.
2021-10-11
Checking in again on 2021-04 Quantum Country schedule experiment a couple months later via 20210708114116.
20th/50th/80th percentile accuracies at first review:
- 2021-04-A (1 week, N=22): 79% / 83% / 93%
- 2021-04-B (2 weeks, N=20): 74% / 85% / 91%
- 2021-04-C (1 month, N=11): 70% / 86% / 95%
(2 months only has 3 users—pretty clear that destroyed retention… and likely that 1 month did too… worth exploring/quantifying)
Conditioned on first answer correct? 20211011111522
- 1 week: 81% / 85% / 94%
- 2 weeks: 79% / 87% / 93%
- 1 month: 75% / 84% / 95%
And conditioned on first answer incorrect? I haven’t actually run the numbers, but the deltas here are small enough that I doubt they matter a huge amount.
One more idea: control for selection effects to some degree by lumping everyone together? Yeah, OK:
- 1 week (N=151): 82%
- 2 weeks (N=130): 83%
- 1 month (N=127): 79%
- 2 months (N=133): 75%
The effect should be magnified if I exclude prompts forgotten in the essay, since those ISIs are the same across all groups.
Well… hm. 20211011112217
- 1 week (N=102): 85%
- 2 weeks (N=85): 86%
- 1 month (N=63): 83%
- 2 months (N=43): 83%
The trouble here is that, apparently, most of the users in the prior set were showing up for their missed-question reviews, but not returning. And the selection effects are stronger for the longer intervals—makes sense. But what this means is that anticipated effects of increased forgetting are offset by more intense selection effects. Guh.
I could compare only those 1-week people who actually stick around for 1 month, but it’s not clear that this is a fair comparison: after all, they’ll have spent much more time on net.
Alright. What if I focus on prompts forgotten during the essay, looking at the first review after the “re-review” session? This looks somewhat more reasonable. 20211011120323
- 1 week (66 users, 553 reviews): 84%
- 2 weeks (63 users, 406 reviews): 75%
- 1 month (48 users, 284 reviews): 67%
- 2 months (17 users, 120 reviews): 55%
This is pretty remarkable.
This data supports Quantum Country users seem to forget most prompts quite slowly for the case of questions answered correctly while reading the essay, but not for those forgotten. Still quite surprising.
Can it just be people lying? I don’t think this data can support that: the median user marks 14-17% of their prompts as forgotten in the first review. So they’re not grossly lying, and there is some variation. The question is why the variation isn’t bigger.
OK. Well… hm. This really needs more thought if I’m going to do anything with it.
Also quite striking that since April, only 75 readers have collected and reviewed all prompts at least once. That’s… a very low rate. So low that I’m unlikely to be able to really use QCVC as a passive observatory. I need to understand which parts of the funnel are changing here. Is it just that we’re getting less traffic? Or is it really that people are abandoning to a greater extent? Even if all cohorts behaved like the 1 week cohort, it still wouldn’t be that many people for five months!
2021-07-19
I’m concerned that with 2021-04 Quantum Country schedule experiment, a lot of people are having the following unfortunate experience: they forget five or six questions on their first read through… then have a session due the next day… and they forget two in that session… and then they have another session due! Is this happening?
- How many questions do people tend to forget in their first read, anyway?
- OK, a lot! 20/50/80 is 4/12/23! 20210719095848
- How many already-forgotten questions do experimental-schedule people forget in their first session?
- 20/50/80 is 1/10/25! (N=114) 20210719100936
- And so, presumably, they get stuck in a sequence of reviewing the things they’ve forgotten.
- Not actually that bad. Before first long break, 70% of users have only 1 session. Only 20% have 3+. That’s still a large-ish chunk, I guess. Batching is saving us, I suppose.
- But people are forgetting after their first long session, so 20/50/80 total short sessions after that is 0 / 2 / 4. Note that this is a total count: it includes the short sessions before the first session too. Ohh… and, there’ll also be short sessions here because you’re going through all the prompts, and there’s a cap. So this isn’t really worrisome.
- So in total, before the second long review break, most people have <= 2 short sessions, and 80% of people have <= 4. That seems… fine, I guess. I’m feeling disinclined to fiddle with this for now.
Checking in on 2021-04 Quantum Country schedule experiment today. First crack: 20210708114116
Surprised to only see 15 users in the most rapid schedule (2021-04-A, first interval 1 week). Probably can’t learn anything from that. Is it telling that the number of people who have finished their first repetition in 2021-04-B (first interval 2 weeks) is only 9, almost half as many? It’s been almost three months. Are these rates typical? 20210708115913
- aggressiveStart: 9928 users registered -> 2046 completing QCVC (21%) -> 997 completing first review (49%)
- 2021-04-A: 180 users registered -> 38 completing QCVC (21%) -> 15 completing first review (40%)
- 2021-04-B: 156 users registered -> 30 completing QCVC (19%) -> 9 completing first review (30%)
These are… at least not wildly out of wack. There might be a real drop in compliance among 2021-04-B users, but it’s hard to tell with numbers this small. Matching aggressiveStart would mean just 5 more users completing their reviews. Also, the number for aggressiveStart is naturally going to be somewhat larger because those readers have had months/years to finish their first review (possibly returning some time later). So I don’t think it’s the case that we’ve tanked compliance or anything like that.
Alright. Can we see anything in the first-repetition accuracies? (20th/50th/80th %iles):
- one week: 79% / 83% / 93% (N=15)
- two weeks: 75% / 85% / 95% (N=9)
… ¯_(ツ)_/¯
Check back later, I guess.
What can I say about the impact of introducing spaced repetition prompts in the context of the essay, as opposed to presenting them as separate flashcards?
In-essay Quantum Country prompts boost performance on first repetition
Analyzing the impact of retry again, now with a few months more data. I think this’ll be enough to see what I need.
Today’s data: 20210412091240
What do I see?
- pronounced retry-vs-no-retry differences:
- in the first repetition (9pp)
- second repetition, conditioned on first correct (6pp)
- second repetition, conditioned on first retry: (10pp)
- second repetition, conditioned on first no-retry: (10pp)
- the improvements stack somewhat: two retries vs two no-retries is a 18pp difference
- diminishing differences once the item has been recalled:
- after two successful attempts: 1pp
- in-essay retry followed by success same as in-essay no-retry followed by success
Lasting impact of retry vs no-retry in-essay persists for first two repetitions but then disappears by third:
🔄, repetition 1: 41% (N=968)
❌, repetition 1: 32% (N=562)
🔄, repetition 2: 61% (N=919)
❌, repetition 2: 53% (N=533)
🔄, repetition 3: 72% (N=893)
❌, repetition 3: 72% (N=498)
This isn’t really a fair comparison, though, because the distributions of intervals are so different. A better way to look at this would be something like… % of paths with at least 1 successful attempt.
🔄, repetition 1: attainment 41% (N=968)
❌, repetition 1: attainment 32% (N=562)
🔄, repetition 2: attainment 72% (N=919)
❌, repetition 2: attainment 62% (N=533)
🔄, repetition 3: attainment 86% (N=893)
❌, repetition 3: attainment 84% (N=498)
By the third repetition, the same proportion of paths have had at least one repetition. But I don’t think this is very instructive. Not the right framing. You really want to know something about the long-term impact: how many repetitions it takes to maintain for N days, etc. And so retry increases the % of people who require a smaller number of repetitions.
What about variations of initial prefixes?
For multiple initial forgetting, you see roughly the accuracies you’d expect:
🔄🔄, repetition 2: accuracy 54% (N=325); answered >= 1 correctly: 54% (N=325)
🔄❌, repetition 2: accuracy 44% (N=199); answered >= 1 correctly: 44% (N=199)
❌🔄, repetition 2: accuracy 46% (N=236); answered >= 1 correctly: 46% (N=236)
❌❌, repetition 2: accuracy 36% (N=119); answered >= 1 correctly: 36% (N=119)
🔄🔄, repetition 3: accuracy 65% (N=309); answered >= 1 correctly: 78% (N=309)
🔄❌, repetition 3: accuracy 58% (N=191); answered >= 1 correctly: 72% (N=191)
❌🔄, repetition 3: accuracy 70% (N=217); answered >= 1 correctly: 81% (N=217)
❌❌, repetition 3: accuracy 55% (N=105); answered >= 1 correctly: 65% (N=105)
With the exception of ❌🔄, repetition 3, which is surprisingly high. I guess perhaps it suggests that there’s a bias towards the more recent intervention (here, a retry).
When the answer is remembered in-essay, we see a similar pattern:
✅🔄, repetition 2: accuracy 67% (N=1322); answered >= 1 correctly: 100% (N=1322)
✅❌, repetition 2: accuracy 61% (N=660); answered >= 1 correctly: 100% (N=660)
✅🔄, repetition 3: accuracy 81% (N=1287); answered >= 1 correctly: 100% (N=1287)
✅❌, repetition 3: accuracy 74% (N=634); answered >= 1 correctly: 100% (N=634)
✅🔄, repetition 4: accuracy 79% (N=603); answered >= 1 correctly: 100% (N=603)
✅❌, repetition 4: accuracy 81% (N=298); answered >= 1 correctly: 100% (N=298)
i.e. the retry paths perform better than the forgotten paths, but the different disappears two repetitions later.
Summarized in Retry intervention produces substantial increases in early accuracy on Quantum Country
Analysis for Balaji experiment
First off, basically no one reads QCVC in one sitting. 20210412204624
Surprising how foolish / unscrupulous people are. Of ~200 entries for the task with Balaji Srinivasan, only ~66 look legit. Others read supernaturally quickly, had many standard deviations away from normal accuracy rates, didn’t even finish, or were duplicate entries. 20210412210201
Balaji points out that it works better to have some public validation of identity—feels higher stakes. Not sure how to do that while avoiding performativity. For example, rewarding reviews of a book mostly causes crappy inauthentic reviews to be written.
Quantum Country users who forget in-essay exhibit sharp forgetting curves
- Of
originalschedule users who forgot in the first repetition but remembered (1 day later), 87% remembered in their second repetition (N=10217) 20210408113612 - For
aggressiveStartusers: 85% (N=9232).
Not a substantial Spacing effect there.
If I don’t condition on the first repetition’s answer:
original: 71% (N=18026)aggressiveStart: 73% (N=16872)
I suspect this difference is explicable by the difference in the presence of the retry mechanism.
Maintenance costs: how many repetitions in the first year? We only have data on old-schedule users for the most part. Median (IQR) is 802 (777-860). 20210326120121
For new-schedule users, the first half-year of all QCVC takes median (IQR) of 452 (404-472, N=30).
If I count still-due prompts (a plausible thing to do), the first year of new-schedule QCVC takes 567 (525-593, N=22) 20210326120718
And how much time does that take? 87 minutes (66-112). 20210326121444
How many repetitions after the initial success? 448 (415-483). 20210326134451
- 95% of Quantum Country questions produce no lapses for most readers’ first half year
- Quantum Country readers forget about as many times before their first successful repetition as they do in the following half year
Continued writing 2021-03-23 Note to Michael on flat forgetting curves.
- Performance in-essay and in first review strongly predict a Quantum Country reader’s future performance on that question
- Accuracy rates for withheld Quantum Country questions were roughly equal at 5 days and 1 month (2020 efficacy experiment)
OK, so Half of all long-term Quantum Country lapses come from just 12% of its questions… but does that translate into meaningful differences in terms of the amount of work people are doing? Are most of the attempts also attributable to just a few questions?
If we count the number of attempts each user needs to practice over the course of a year, there’s surprisingly little variation (20210319144224). The easiest questions requires 5/6/6 repetitions for the 25th/50th/75th percentile user; the “hardest” questions require 6/8/10. So the experience for most users seems to be quite uniform.
Averages are more skewed (20210319145756); min / 25th / 50th / 75th / max are: 5.6, 6.2, 6.84, 7.66, 11.9. This comports with the power-law distribution of question difficulties, and it highlights an extremely unequal distribution of extra attempts for those difficult questions among users: the bottom couple deciles of users do almost twice as many repetitions of the few hardest questions. But the median user does only a little more work.
2021-03-18
Can I determine if different questions are forgotten at different rates? The challenge here is that I don’t think I can distinguish between the following two hypotheses:
- People are more familiar with some questions in advance than others. So the same amount of forgetting is happening, but from different starting points
- People forget different questions at different rates
Well, OK, I think I can tell the difference. Two potential ways:
- Forgetting curve experiments may show clear deltas between 5 day and 1 month forgetting rates
- Can compare in efficacy trial the initial rates vs final rates
Looking at forgetting curves for bottom 15 QCVC questions, I see what’s probably mostly noise 20210318153212: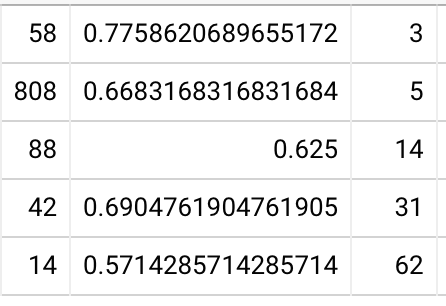
Not enough samples. What about bottom half / top half?
Bottom 20210318153424: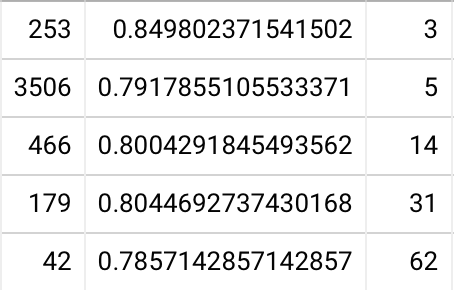
Top 20210318153556: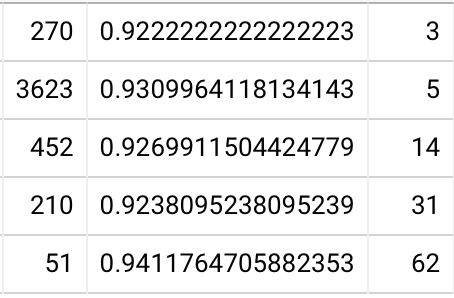
Wow. OK, so people don’t forget stuff. I suppose it’s worth noting that these queries are conditioned on people remembering the first time. So maybe it’s stuff they already know well? Or maybe I’m selecting for particularly conscientious people?
If I remove that condition, I don’t see much difference (here’s the bottom and top halves of the distribution):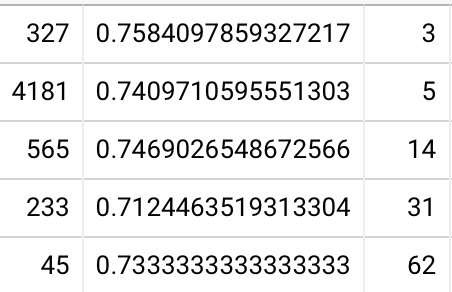
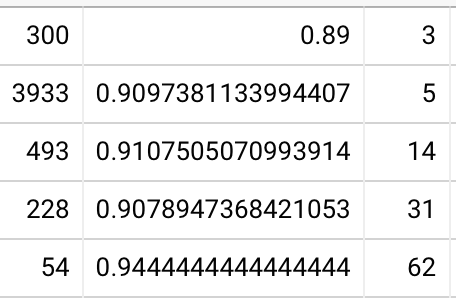
How do I interpret these numbers? There’s a consistent difference between performance on these questions, but it’s not attributable to different rates of forgetting. Maybe it could be attributable to differences in prior knowledge, but it’s strange that it shows up this strongly even when I insist that the in-essay review is successful.
Actually, there’s a simple way to model it. IRT (without forgetting dynamics) suffices. “Harder” questions have a lower recall probability. Higher-ability students are more likely to answer correctly. By selecting only the people who answered correctly the first time, I introduce a slight selection pressure for higher-ability students. But recall performance is still dominated by question difficulty, rather than forgetting effects. And that question difficulty parameter is the main thing driving lapses later, which is why these halves of the distribution look so different.
The inconsistent bit here is that the efficacy trial shows “harder” questions being forgotten at much higher rates. One difference, I guess, is that in that trial, the questions aren’t even present in the text. But I just don’t buy that that could make such a huge difference.
Eh. Just spitballing a bit here… if we look just at forgetting curves for forgotten questions: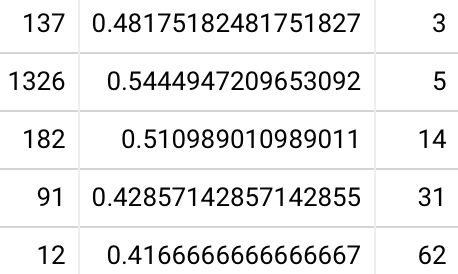
We end up with 1-month values which look somewhat like our efficacy trial data (for the hardest questions). And these numbers should be somewhat higher relative to those, since these represent people who got an opportunity to test themselves and retry. The worst of these questions, for example (xiNW1zgeb2ITHGi6uQtg), has a 62% in-essay accuracy rate. So the forgetting rates we’re seeing aren’t so ridiculous.
But I still can’t clearly distinguish forgetting processes from differences in initial performance.
Lots of investigation, summarized in:
- Half of all long-term Quantum Country lapses come from just 12% of its questions
- In-essay per-question accuracies on Quantum Country don’t effectively predict which questions drive long-term lapses (but first repetition accuracies do)
- Withheld Quantum Country questions have highly variable accuracy rates (2020 efficacy study)
2021-03-16
A new hypothesis… given the extreme spread in inter-item memory difficulty, a better way to think about efficiency for the mnemonic medium may be that most of the efficiency benefit is likely available by avoiding scheduling too-easy items. And most of the time it seems items are too easy.
Let’s look into this. First, I want to understand how our scheduler works for items which are clearly “learned.”
- Demonstrated retention reliably bounds future recall attempts on Quantum Country
- Quantum Country users rarely forget after demonstrating five-day retention
2021-03-09
I tried to look at the influence that answering one question before another has on question accuracy: 20210309100759
Are user accuracies normally distributed? 20210309102137
In-essay (QCVC, of the 1,915 readers who collected all 112):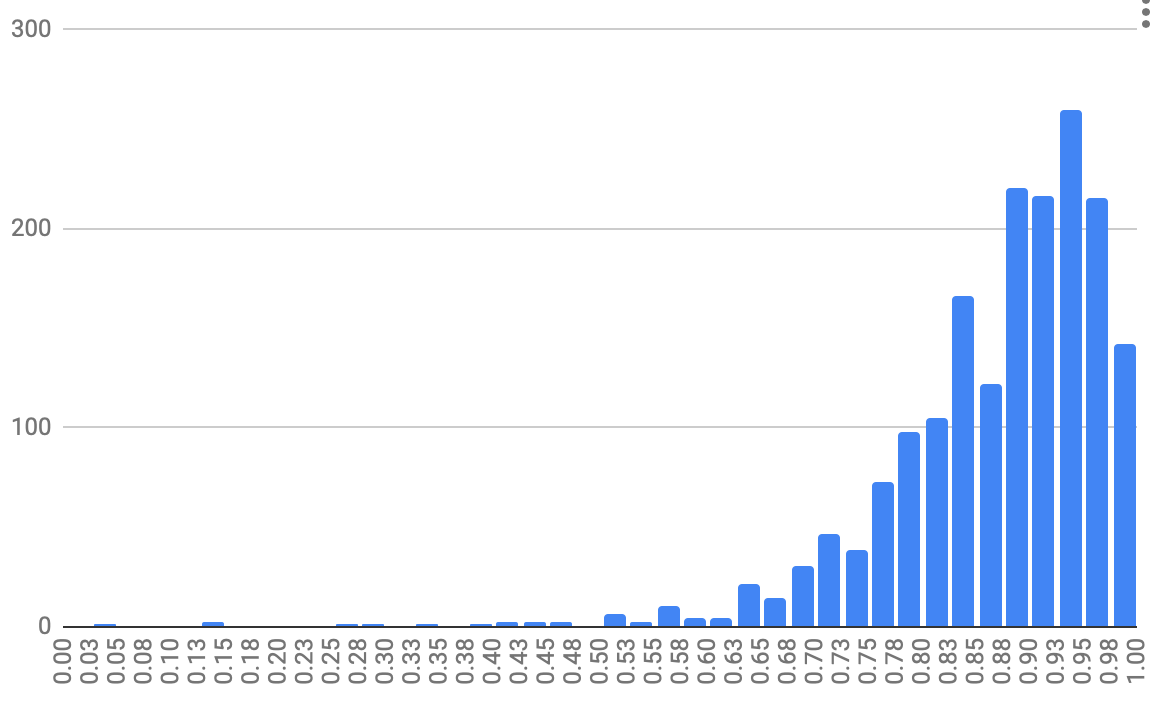
Maybe… kinda? A truncated normal?
Some figures:
- 30% of users have >= 95%
- 55% of users have >= 90% (wow: most users are above 90%! surprising…)
- 70% of users have >= 85%
- 83% of users have >= 80%
- 90% of users have >= 75%
- 95% of users have >= 70%
First review session: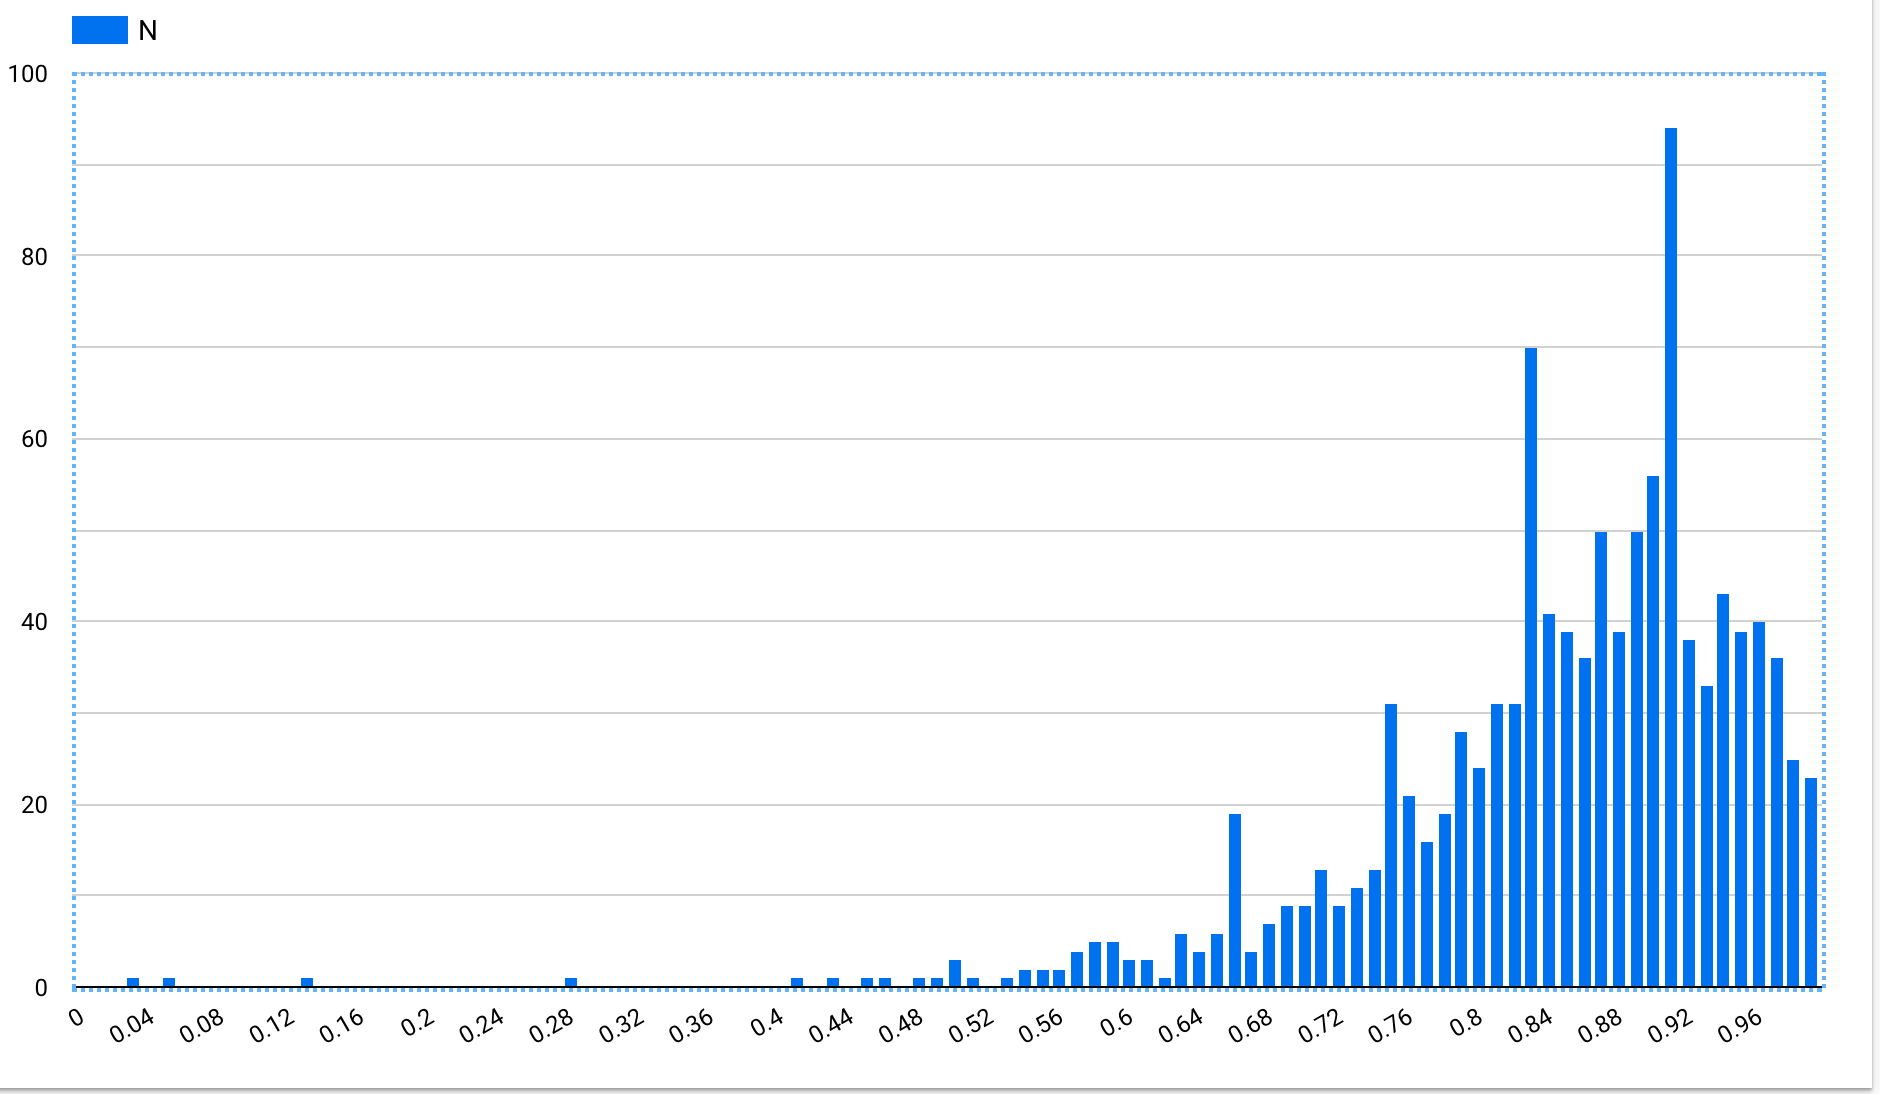
…I guess? Yeah, that might be normal-ish?
Means and standard deviations of user accuracies by review number (20210309104455):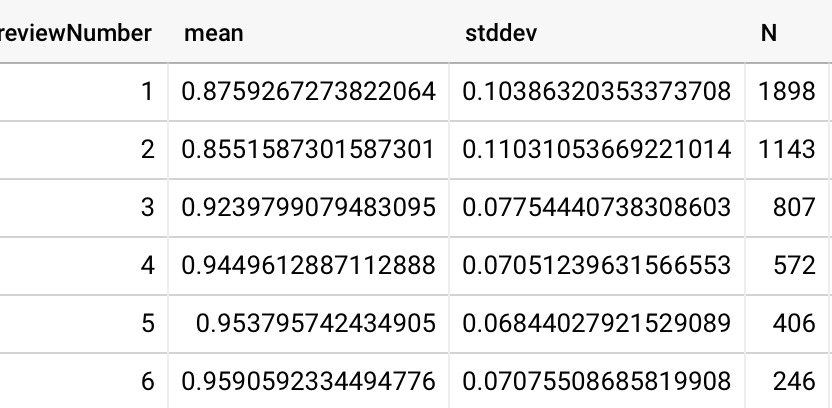
2021-03-08
I looked at the Odds ratio of question pairs in QCVC. There’s a great deal of association: 97% of the question pairs had positive log odds ratios. 20210308154847
Managed to create a query to KNN cluster the questions. Not sure if this will reveal anything at all. Feels silly to choose the number of clusters. 20210308164700
It doesn’t really seem to have done anything. Sigh.
2021-03-08
Last week I looked briefly into the spacing function for Quantum Country’s Spacing effect as far as I can currently see it, but I didn’t document that. Quickly summarizing (20210216100755)…
Conditioned on remembering the answer correctly the first time (i.e. P(√|√)): 5/14: 92% (N=1846); 14/14: 96% (N=317); 31/14: 96% (N=92).
Conditioned on forgetting the first time (i.e. P(X|√)): 5/5: 64% (N=429); 14/5: 60% (N=67); 31/5: 68% (N=22)
Unconditioned: 5/14: 90% (N=1922); 14/14: 95% (N=331); 31/14: 96% (N=92).
So we may observe something like a spacing function. The function shapes are almost certainly different given the two conditions.
2021-03-04
One measure of the efficiency of a memory system is how often it makes “false negative” errors—i.e. asks you to reinforce an item which you already remember effectively. Could we see that through response times?
Looking at response times by # of correct answers (20210203104423) and by interval (20210304103034), the answer seems to be no. 25th %ile is 4-5s—not totally trivial.
Restricting to just an easy card (“what’s HH?” 5e3YiL6Siz0bV4iJaAvW), 25th %ile falls to 3 seconds or less. But the medians are still 4s+, even when the answer is remembered. That doesn’t seem fast enough for a “yeah yeah, this question, get out of here” type response.
2021-03-03
I’m going to peek at updated forgetting curve data, since it’s been a month. It’s still consistently the same! With way more data! Yikes!!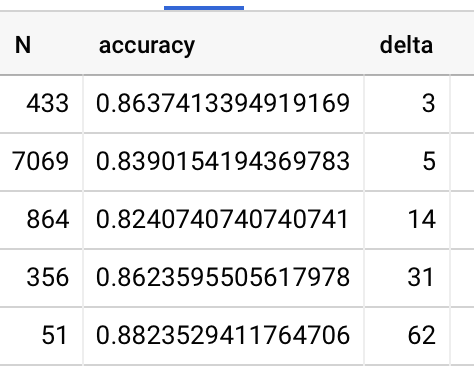
If I restrict the data to memory traces which span at least 31 days, I get even more confident results that a 31 day interval yields higher accuracy!
What is going on?! This is really distressing. It’s suggesting that one of our core assumptions—a key assumption that the system is built on—is wrong. One theory is that reviewing “nearby” prompts is strengthening these held-out prompts. But to this degree? For 300+ reviews? I just don’t buy it.
A more persuasive theory is that after people have been reviewing for a month, their default becomes that they remember the answers to questions, so some of them are just blithely clicking through. Answer latency looks basically the same for these different intervals, so it’s not some kind of automatic processing thing: people are spending time on these. Actually… too much time? The median’s 15 seconds. That seems high! I guess I see a median of around 11 if I throw out responses which take more than a minute. OK. But still. What is going on?!
It’s hard to imagine running experiments and using accuracy data to mean anything when I’m seeing results like this.
11:20 AM
Bluh. Feeling helpless. How can I unstick myself here? What hypotheses do I have about this anomaly? What experiments could I run to validate them? How could I simply be in error?
Well, OK, here’s maybe one clue. Why are the post-forgotten accuracy rates so bad? Interestingly, they get worse if I add the requirement of a 1-month trace. Why? I notice that this cuts out about 3/4 of the samples. So maybe it’s just a noise thing. But I’m trying to understand why there might be a population bias, because maybe that would explain why the 31-interval users are so weird. Are most recent users just performing super differently or something? Maybe there’s some big cohort of QC students? I don’t see any discontinuities in registrations. There was a big spike in June 2020—not sure what that’s about—but I don’t see anything else significant.
The P(√ | X) accuracies still seem too low—lower than I was seeing in the analysis I’d been doing of retry impact. Oh. It’s because I was only looking at the people who didn’t have a chance to retry. Now the data’s consistent.
OK. Well. I still haven’t solved my problem. If I start excluding traces which haven’t persisted very long, that’s going to disproportionately affect the 5-day and 14-day interval samples. Not the 31-day samples, which remain stubbornly at 86% (!!!) accuracy. What’s going on?!
Bluh. One final hypothesis, though it’s not terribly plausible: almost all the traces here are one-and-done-style traces. They read the text; they already sorta knew the thing being tested; they’re done! Just as likely to remember after 31 days as after 5.
1:17 PM
Took a walk. Cleared my head. I still have no idea what’s going on. This data just seems really inconsistent with the other efficacy trials. But is it? We now have roughly three “memory counterfactual” trials:
- Q3 2019: 87% after 2 weeks (with in-essay prompts)
- 2020-01 Quantum Country efficacy experiment: 68% after 1 month (without in-essay prompts)
- this trial: 85% after 2 weeks (with in-essay); 82% after 1 month
Here I’m showing the gross accuracy over all users, irrespective of whether they forgot or remembered in-essay. But the way the query works, I’m only using the users who didn’t have a chance to retry. So it makes sense that we’d maybe lose a couple pp.
So… perhaps it actually is consistent? And the difference between this most recent experiment and the early 2020 experiment is actually due to the presence of the prompts within the essay experience? It’s… just really hard to buy.
Why is there almost no difference in forgetting between 5 days and 2 weeks? And almost no more between 2 weeks and 1 month? Could it really be that this is all just due to threshold effects? i.e. there is forgetting, but it’s not meaningfully shifting how much of the distribution sits above the threshold? Boy… all the more reason to somehow get a continuous measure.
(And yet the retry experiments produce such strong results? Dubious!!)
2:16 PM
Alright, last analysis thing I’ll try. What about differences in users who retried? So far when I’ve looked different schedules for users who forgot the first time, I’m only looking at the ones who didn’t retry. So maybe there’s not much difference because they already didn’t remember… so changing the interval to the next attempt won’t produce a result which meaningfully depends on memory. Turns out I’ve actually produced a query which includes the users who had a chance to retry: 20210201103413. The numbers here look perhaps more reasonable…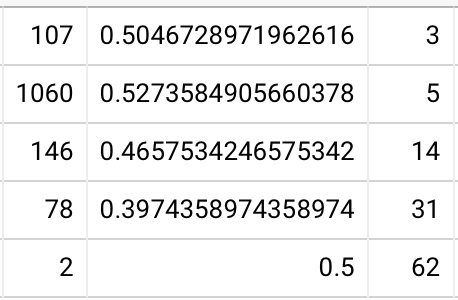
They seem a little low? Earlier I was seeing P(√ | X) at mid-to-high 50%’s. But OK, I guess. Still, it seems like the skew should be higher here. If I look only at users who had a chance to retry (20210303144755), I see a starker picture, which seems to support my intuitive hypothesis that memory is more involved when retry is in the picture.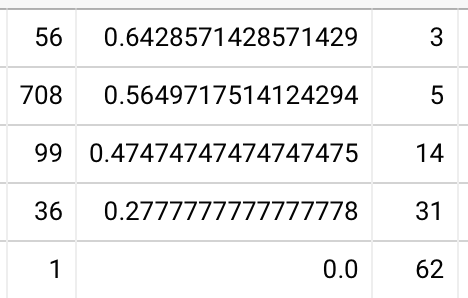
OK. This actually makes some sense. The story I can tell is something like: for users who remembered the answer the first time, roughly the same % answer correctly irrespective of the subsequent review interval; for those who forgot and retried, the choice of review interval has a fairly substantial impact on their subsequent recall rate. Note that this does not mean that depth of encoding is unaffected by review schedule—just that the distribution of depth of encodings is skewed enough that it’s not terribly time dependent.
Data from Ebbinghaus, H. (1913). Memory: A Contribution to Experimental Psychology (H. A. Ruger & C. E. Bussenius, Trans.). (Original work published 1885) would suggest that more complex memory traces should decay faster. If I look at only traces from the hardest questions, do I see a forgetting curve? 20210303145126 Eh… not really enough data.
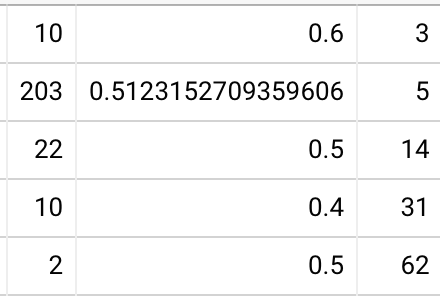
Here’s all samples, including where it was forgotten on the first attempt: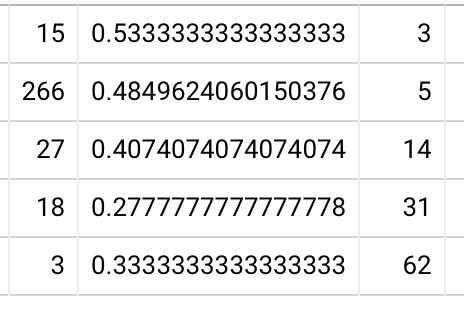
Trending towards something? Maybe?
2021-03-02
I’ve spent the last pomo thinking about the forgetting data in 2020-01 Quantum Country efficacy experiment. I want to try to look at this from a within-subjects perspective, rather than a between-subjects perspective. After all, what we’re trying to say is how much forgetting happens.
First off: users’ accuracies on this subset of cards is highly correlated with their accuracy on the rest of the cards (r=0.78) 20210302152754. So it’s fairly reasonable to imagine that a given person would probably score about as well on the experimental cards as on the control cards.
A straight delta between the one month control and experimental isn’t quite what I want because so much of the distribution appears to be clipped on the right. I’m trying to find some way to “bias” by their original score. Something like… to what degree does their original score predict what happens?
Thinking through my actual hypothesis, I think it’s something like… people who initially did very well end up still doing pretty well; people who didn’t do much better when they’ve reviewed. So I looked at the distribution of initial performance and split into 5 roughly even-sized buckets. And my hypothesis plays out quite neatly. After all this data munging, it’s pretty consistent with the overall message: “most people who don’t review forget about a third of the material.” 20210302162337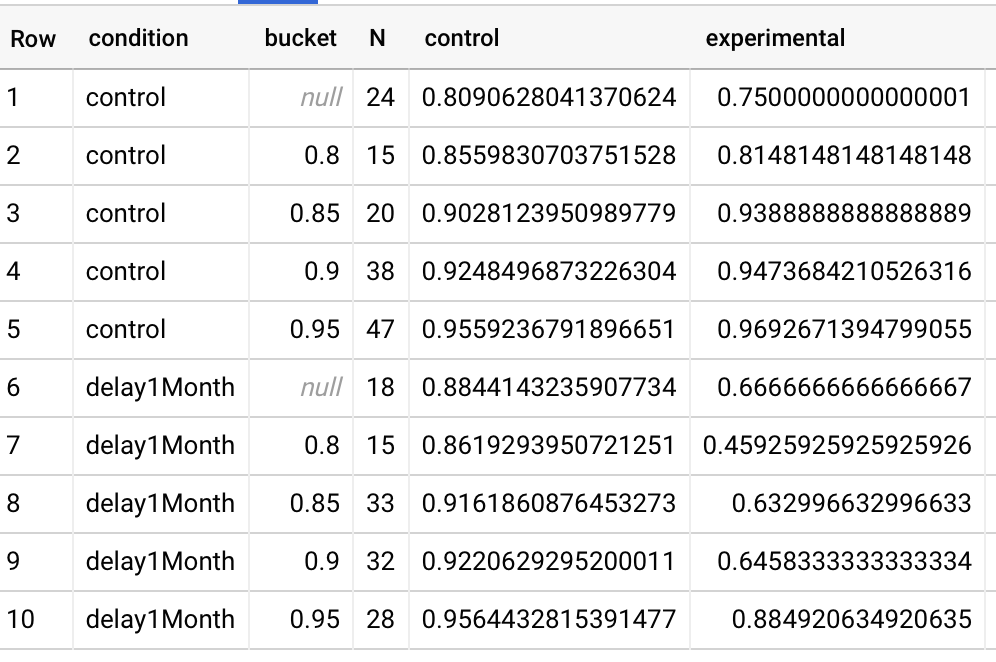
OK. Next up is looking at card-level data, I guess. I still don’t feel I have a very good feel for what’s going on here. I’m very surprised that people remember so much!
Checked in on 2020-01 Quantum Country efficacy experiment. Seeing roughly consistent data now. But it occurs to me that ==it may be very interesting to look at card-level data.== Some cards may have all the variance.
2021-02-23
Checking in again on the “storage strength” hypothesis… the 5/14 vs 14/14 √√ traces look even better now: 90%±2% and 96%±2%. n.b. also: 5/31 is 96%±3%. Hm. Why higher? If I accept 14/14 being higher as a real effect, this would suggest I must accept 5/31 > 5/14 as a real effect. Dubious.
What’s going on? I’m controlling for memory traces that have data over at least 31 days. When I change that threshold to 45 days (perhaps more appropriate for 5/31), I get 5/14 = 85±4% (N=337), 5/31 = 91±6% (N=87). Those error bars overlap. But 14/14 = 93±8%. Too wide to say.
It’ll probably be a few months before we can say anything about √X timing differences. If I think that’s important, I could shift the distribution. X√ is also quite ambiguous.
11:28 AM: Just realized that I can run the trace analyzer on all the Quantum Country samples. I don’t need to limit myself to the with-retry-experiment data. I just started there because I wanted to understand the causal effects of retry. I’m hoping I can see some stationarity patterns there.
I… don’t really know what to make of it. Here’s a long cut from it: 20210223141905
But I think much of the story here is about the differences between cards. Here’s analysis applied only to z4EBG9jGf2S5SxLiCfTECfTTwLtttWzt3QrdMDpeDKby8u8MzDa, the Hadamard gate prompt. Still don’t really know what to make of it:
: 80% ±2% (1395 responses, 1395 users)
✅: 57% ±3% (1116 responses, 1116 users)
❌: 32% ±5% (279 responses, 279 users)
✅✅: 81% ±3% (631 responses, 631 users)
✅❌: 53% ±4% (485 responses, 485 users)
❌✅: 57% ±11% (75 responses, 75 users)
❌❌: 40% ±7% (204 responses, 204 users)
✅✅✅: 84% ±3% (508 responses, 508 users)
✅✅❌: 67% ±8% (123 responses, 123 users)
✅❌✅: 74% ±5% (249 responses, 249 users)
✅❌❌: 49% ±6% (236 responses, 236 users)
❌✅✅: 74% ±13% (43 responses, 43 users)
❌❌✅: 65% ±10% (81 responses, 81 users)
❌❌❌: 41% ±9% (123 responses, 123 users)
✅✅✅✅: 86% ±4% (281 responses, 281 users)
✅✅✅❌: 63% ±12% (64 responses, 64 users)
✅✅❌✅: 73% ±11% (64 responses, 64 users)
✅❌✅✅: 79% ±7% (127 responses, 127 users)
✅❌✅❌: 76% ±12% (51 responses, 51 users)
✅❌❌✅: 61% ±11% (79 responses, 79 users)
✅❌❌❌: 44% ±9% (109 responses, 109 users)
❌❌✅✅: 56% ±15% (41 responses, 41 users)
❌❌❌❌: 52% ±12% (63 responses, 63 users)
✅✅✅✅✅: 90% ±5% (151 responses, 151 users)
✅❌✅✅✅: 79% ±10% (67 responses, 67 users)
✅❌❌❌❌: 49% ±14% (47 responses, 47 users)
✅✅✅✅✅✅: 80% ±9% (84 responses, 84 users)
3:07 PM: I think a lot of the trouble I’m having here is due to the fact that these numbers represent fractions of cohorts. But I’m thinking about it as something more like a “depth of encoding” metric. It’s not, and that’s misleading. It’s the fraction of the population above some threshold. Can I use this metric to fabricate a depth of encoding metric? Can I construct that metric in some other way?
2021-02-16
Looked again at memory trace analysis, since it’s been two weeks. Observations:
- When a question is forgotten in the first two repetitions, retry makes the next response much more likely to be remembered, and that effect “stacks” (at least across two instances).
- People who remember tend to keep remembering—those traces’ accuracy rates climb with repetition, despite the increasing intervals.
- Presence/absence of stationarity isn’t yet clear: I’ll need four repetitions to really see, I think. This’ll probably take another month.
I still don’t really know what I’m looking at. These aren’t probabilities, and they aren’t continuous measures of encoding depth—not quite, anyway. They’re fractions of populations in a given situation who are able to remember correctly. I don’t have a strong theory of what this actually means. What would constitute success?
I checked in again on the post-initial-lapse forgetting curves. Roughly doubled the number of samples in the last two weeks, but still not as many as I would like. I’d like to look at the downstream impact of the difference in schedule. I’ll need about twice as many samples as I have now to get a good picture there.
I probably have enough samples now to look at post-initial-success stabilization differences. I expect the difference to be small, since most of these people already have quite stable memories. 20210216100755 But in fact, I see a pretty impressive result. A 5/14 √√ trace yields 89%±2% (N=1007), whereas a 14/14 √√ trace yields 95%±3% (N=176). That’s a stronger effect than I’d expect. I’ll want to ==check in on this again in a few weeks.== A quick look at √X traces shows no difference between 5/5 and 14/5, but not many samples yet.
2021-02-08
Merging in (archived) Log: exploring the impact of retry mechanics on Quantum Country
Gotta shake things up. Feeling stuck. Gonna switch to looking at response times to see if that can nudge me somewhere more interesting.
Well, first off, there is noticeable decline in the time taken for the first few correct responses’: medians of 16.6s in essay -> 11.8s -> 9.5s -> 8.2s -> 7.8s -> 7.7s (over traces which last >= 90 days) 20210203103726
I’m not sure if slicing by correct responses count like this really makes sense. Let’s try across all 90+ day traces: 13.1s -> 11.1s -> 9.4s -> 8.9s -> 8.7s -> 9.2s. Not a terribly interesting distinction. 20210203104007
Do response times predict outcomes? Wow, yeah, a dramatic result. Median response time is almost exactly double for forgotten prompts, consistently through the first 10 review sessions. 20210203104423
But because response times don’t fall very dramatically with increasing practice, I don’t think I can use them as a continuous predictor of retrieval strength. Bummer.
Hm. What if most of the variance is inter-card, not intra-card? Let’s try fixing a cardID. Not terribly interesting. The medians differ fairly substantially between cards, but the trajectories aren’t meaningfully different.
In the shower this morning, I was thinking more about “probabilities” and these odd frequentist estimates I’m making here. Inspired by Ebbinghaus’s comments, I wonder if this is a better way to think about what’s happening:
There is some roughly fixed “threshold” of retrievability. The empirical variation is due to shifts in environment and mental state which effectively push the person’s momentary retrieval strength above or below the threshold. This explains why someone might be able to answer at one moment and not at the next. How could I distinguish this interpretation from other hypotheses? What even are the other leading hypotheses?
Anyway. I’d like to take an early peek at whether I can observe a distinction between “retrieval strength” and “storage strength” via our forgetting curves. In our experiments so far, we’ve found that P(C1 | C0) is roughly the same for 5-day and 2-week intervals. But does P(C2) vary among those two groups? The Two-component model of memory would predict that the 2-week group should perform better than the 5-day group. Unfortunately, that path’s base success rate is 96%, so I doubt we will be able to see a difference. Maybe we can see it among the subgroup which is delayed for a month.
Really aren’t enough samples to see. Among the C1 cohort, the 5-day interval produced 93% C2 (N=1295) and 2-week interval produced 96% C2 (N=119). Worth looking into again in a month or so, perhaps. 20210202095239
The key thing for me here is: so what? These people are already in great shape. 93%, 96%, OK, who cares. I’m trying to understand something about how learning works, but these people have already learned. I think I’ll need to look at the ~C0 cohort to understand what’s going on. I guess I only have six weeks of data from them, and it’s truncated, so if I wait another month, it’ll roughly double. Then what? Let’s think ahead. Say that I observe a strong effect. So what?
I want to be quite wary of just waiting for more data to show up. I suspect I won’t really be able to answer my questions with the current distribution of samples. The sample pools get thin too quickly. I should spend some time honing my questions so that I can measure answers more directly.
Refining how I’m looking at forgetting curves post-lapse to include both with- and without-retry experimental groups: 20210201103413
Interesting that the 3-day accuracy is lower than the 5-day. Could just be error: 95% CI is 14% with so few samples.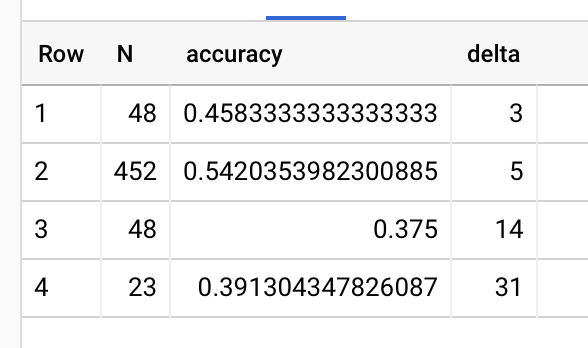
This is with six weeks of data. At this rate, we’ll need a few months’ worth to really see what’s going on. So… should I adjust the proportions? Our system’s batching behavior will prevent many manipulations from really showing up.
First hypothesis: waiting two weeks will produce worse memory rates than waiting 5 days. The early data suggests this may be true. It’s not terribly surprising. So what?
Second hypothesis: waiting less time would produce higher accuracy rates. Not supported by the data! Is that just because of our batching? I suppose I can find out. I queried based on actual delay time (20210201105623) and discovered that there’s little difference in the practical scheduling between 3-day and 5-day intervals: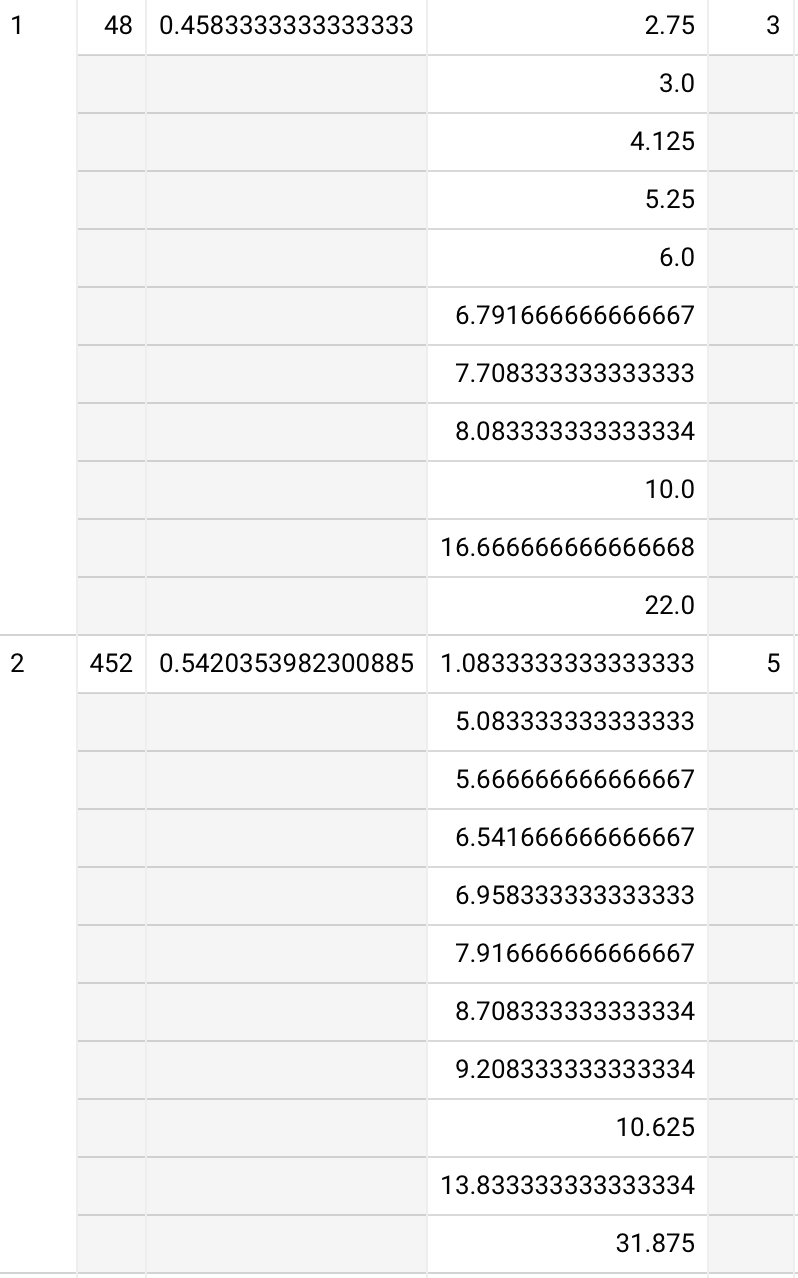
So. What now? How should I even think about these numbers? These numbers represent fractions of people who forgot the answer in the essay session. You can’t directly compare consecutive attempts because they represent different, more highly selected groups of people. Maybe it’s actually quite impressive that half of the people who forgot the thing initially are able to remember it if they get another shot a few days later.
I feel like what I’m running up against here is that I’m not really using the right metric. What matters—even just memory-wise—isn’t really whether they remember in a given review session. It’s the ultimate stability that results (or doesn’t), and the cost to get there.
… which paths (if any!) converge to staying above 90%? That seems pretty good. It roughly corresponds to the idea that lapses are just temporary perturbations. But it doesn’t exactly match that idea: what if 9% fail, then 9% of the failures fail, and so on? Those look like a bunch of 90+% numbers, but a single individual may be experiencing total failure, never recovering. You’d want to be able to distinguish that kind of persistent failure from noise-like variation. And the problem is that the way I’ve been measuring creates these strong selection effects in the subpath populations: the paths aren’t weighted by population size, which I suppose is “really” what you want.
But I guess the kind of analysis I’ve been doing lets us understand how much path dependence there is. Once a failure is past, do the paths converge back towards each other?
Took another look at forgetting curves. We have a lot more data now. 20210126092211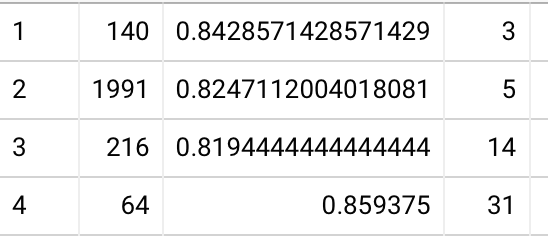
If the user remembered the first answer correctly on the first try in the essay, ==the interval for the first review basically doesn’t matter==! Two weeks is as good as five days! One month might be equally good!
Still not enough samples to evaluate forgetting curves for people who forgot on their first try in-essay. 20210126092745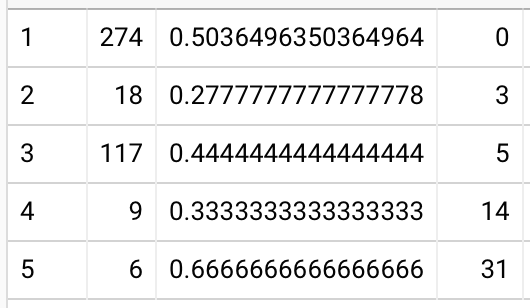
Something’s wrong with these numbers, though. They radically disagree with the numbers I’ve been pulling over in (archived) Log: exploring the impact of retry mechanics on Quantum Country. Of the readers who forgot on their first try and had a chance to retry, only 50% remembered correctly subsequently? No, that’s not right. I think I’m miscounting something somewhere. Feels like something’s wrong with this query, but I don’t care enough to figure it out because there aren’t enough samples for it to matter.
What I’ve found so far in this investigation and in the retry investigation suggests trouble for my forgetting curve plans. Namely:
- almost everyone who remembers the answers to questions continues remembering the answers to questions
- when people fail to remember answers to questions, most of them get a chance to retry, so the forgetting curve manipulation applies to a post-retry mental state
Improved the query—my constraints were wrong. Maybe they still are. These numbers make more sense for first session, post forgetting, with retry: 20210126101452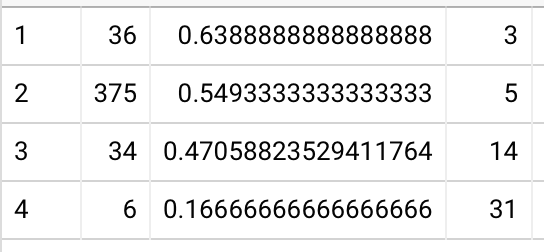
But these numbers still don’t add up. In (archived) Log: exploring the impact of retry mechanics on Quantum Country, I found P(C1 | ~C0, retry) to be 72%. This finds more like 55%. What gives? Oh, I just misread my old notes—that’s all.
2021-01-19
Starting to investigate forgetting curve. We have initial data for first review, though not a ton of samples at the larger intervals yet (this figure is for questions answered correctly in-essay query):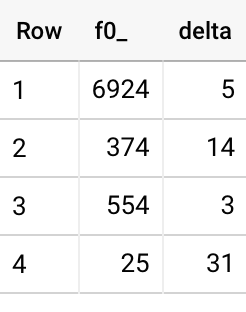
This is some very slow forgetting! About 4pp difference between 5 days and 2 weeks. 1 month is actually higher than 5 days, but I don’t know that I believe it because we have so few samples.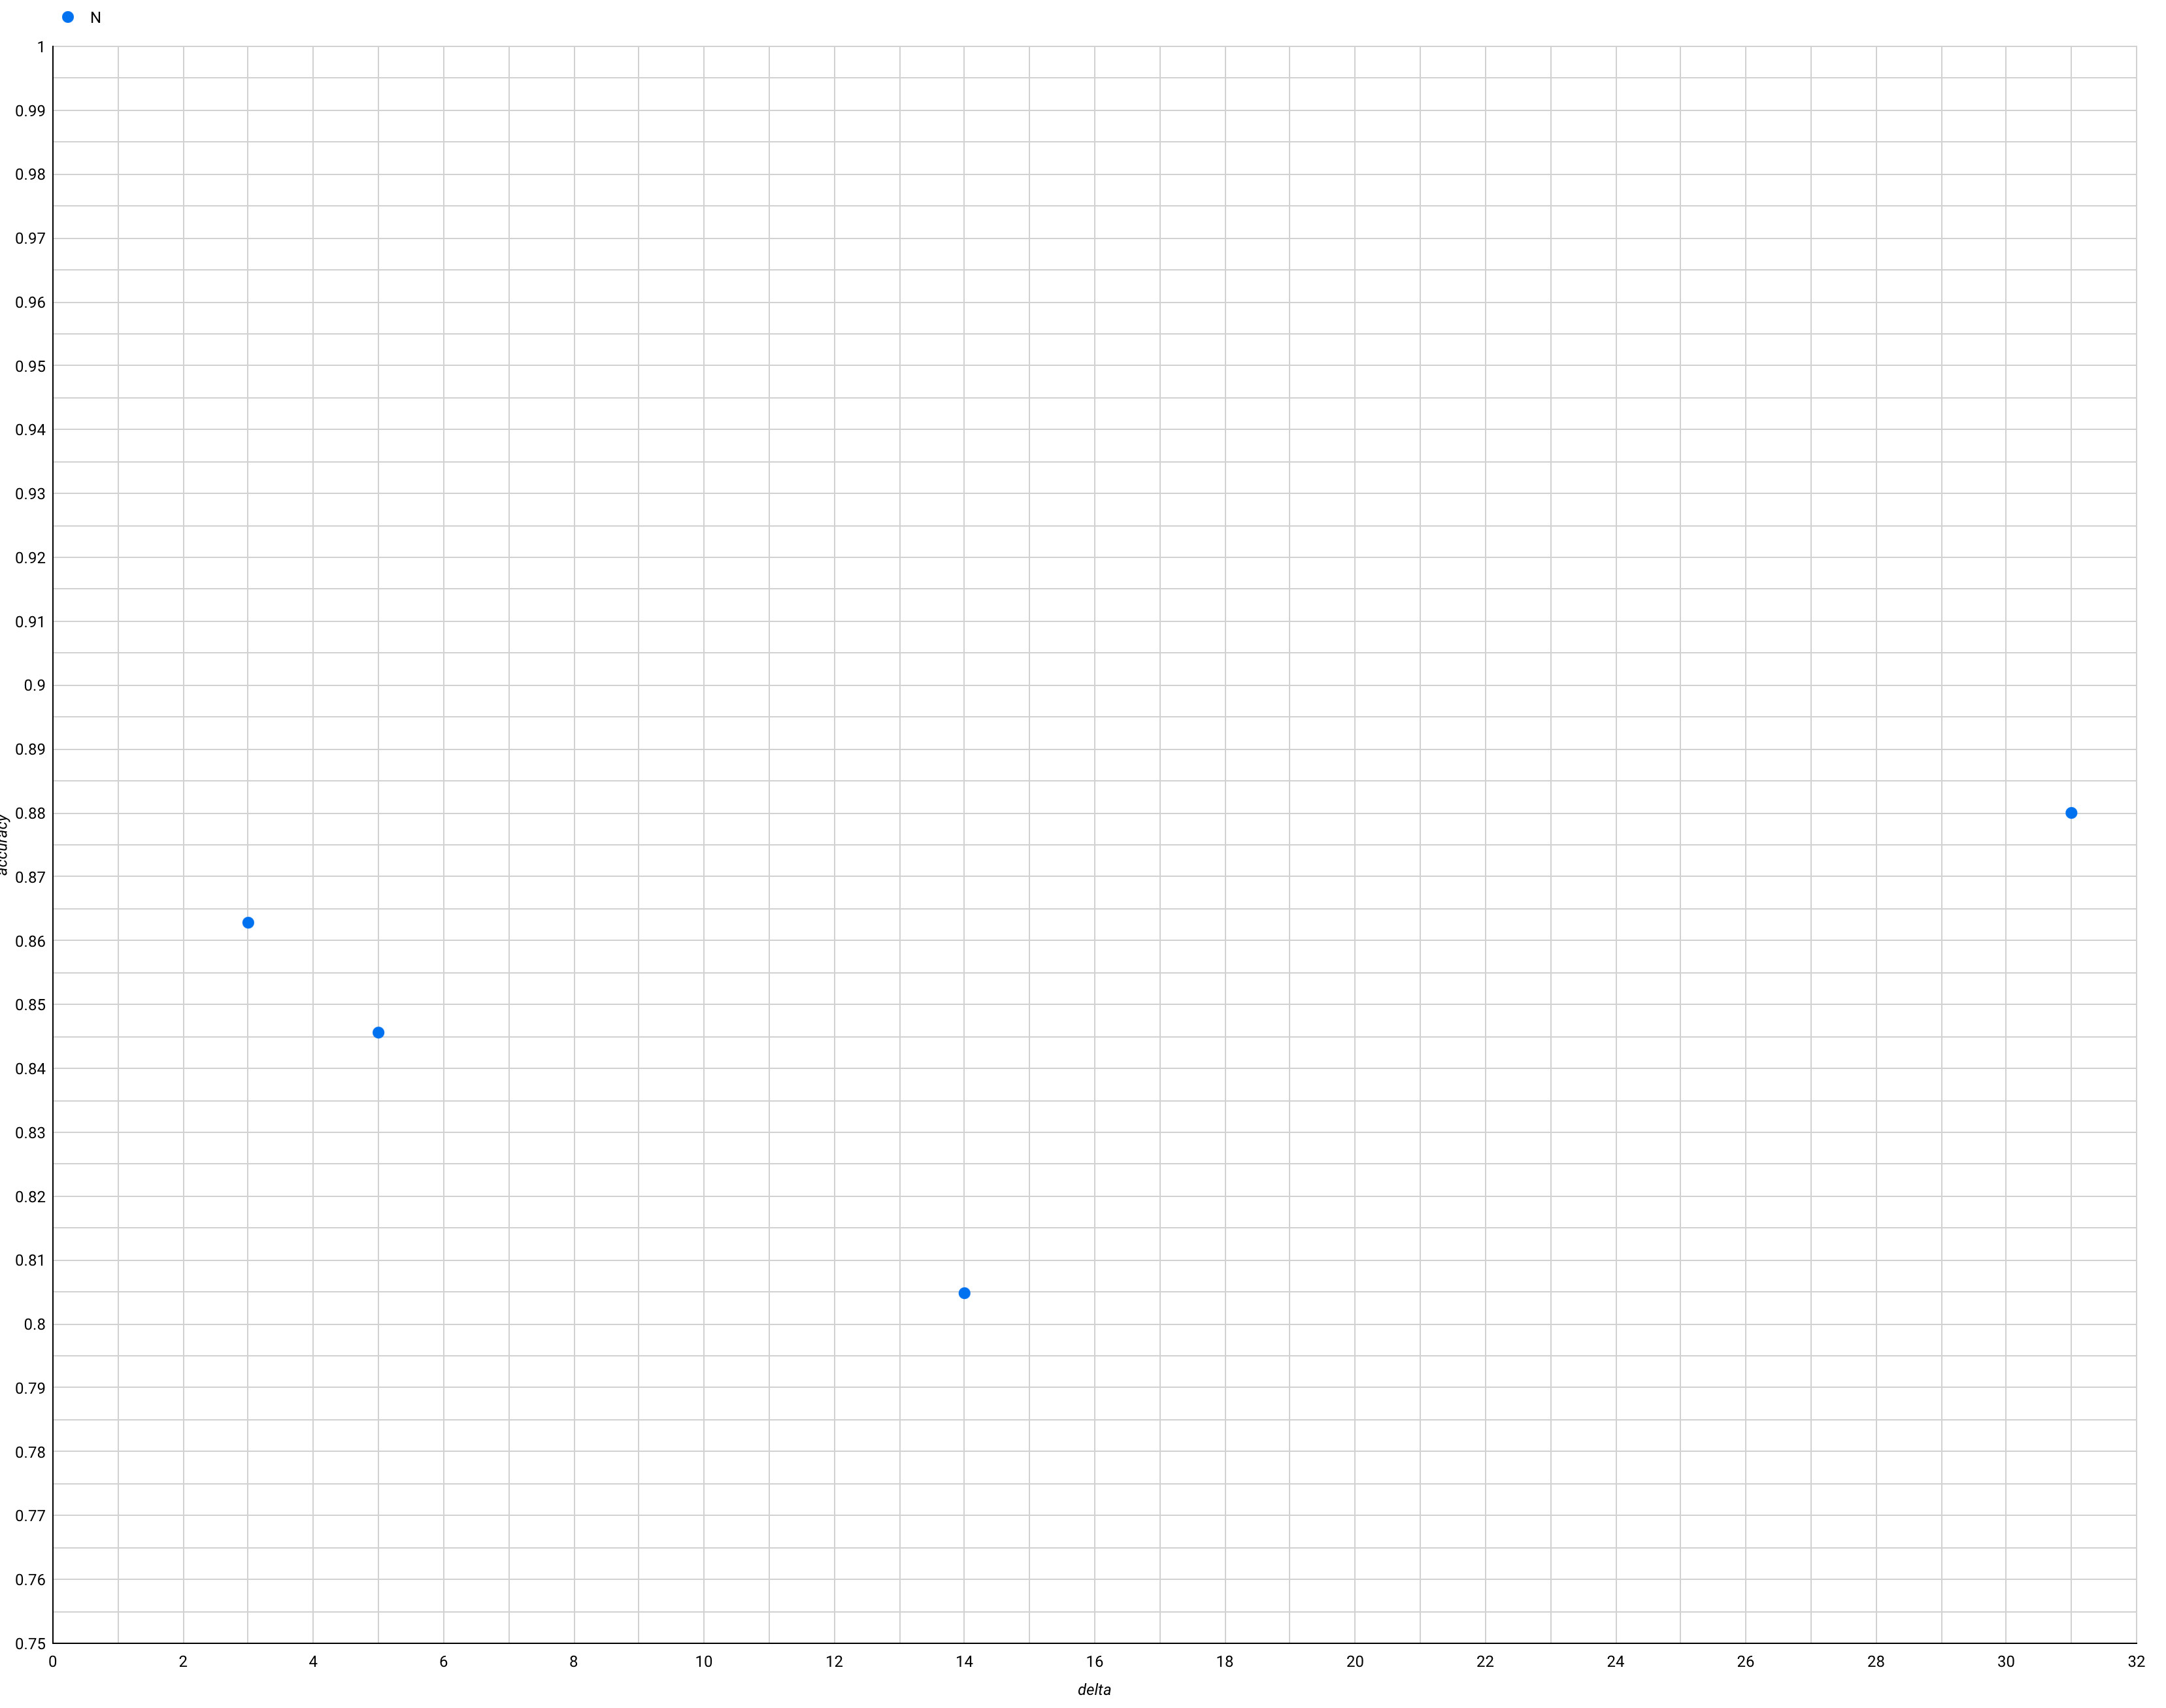
  reviews AS (
  SELECT
    *,
    RANK() OVER (PARTITION BY userID, cardID ORDER BY timestamp ASC) AS reviewNumber,
    LAG(reviewMarking) OVER (PARTITION BY userID, cardID ORDER BY timestamp ASC) AS lastMarking,
    LAG(timestamp) OVER (PARTITION BY userID, cardID ORDER BY timestamp ASC) AS lastTimestamp,
    TIMESTAMP_DIFF(LAG(nextDueTimestamp) OVER (PARTITION BY userID, cardID ORDER BY timestamp ASC), LAG(timestamp) OVER(PARTITION BY userID, cardID ORDER BY timestamp ASC), DAY) AS delta
  FROM
    `logs.reviews`),
  samples AS (
  SELECT
    *
  FROM
    reviews
  WHERE
    reviewNumber = 2
    AND lastMarking="remembered"
    AND lastTimestamp >= TIMESTAMP("2020-12-12"))
SELECT
  COUNT(*) AS N,
  COUNTIF(reviewMarking="remembered")/COUNT(*) AS accuracy,
  delta
FROM
  samples
GROUP BY
  delta
  ORDER BY delta
If we look at people who forgot the answer the first time around, we see a bigger split between 5 and 14 days (about 10pp)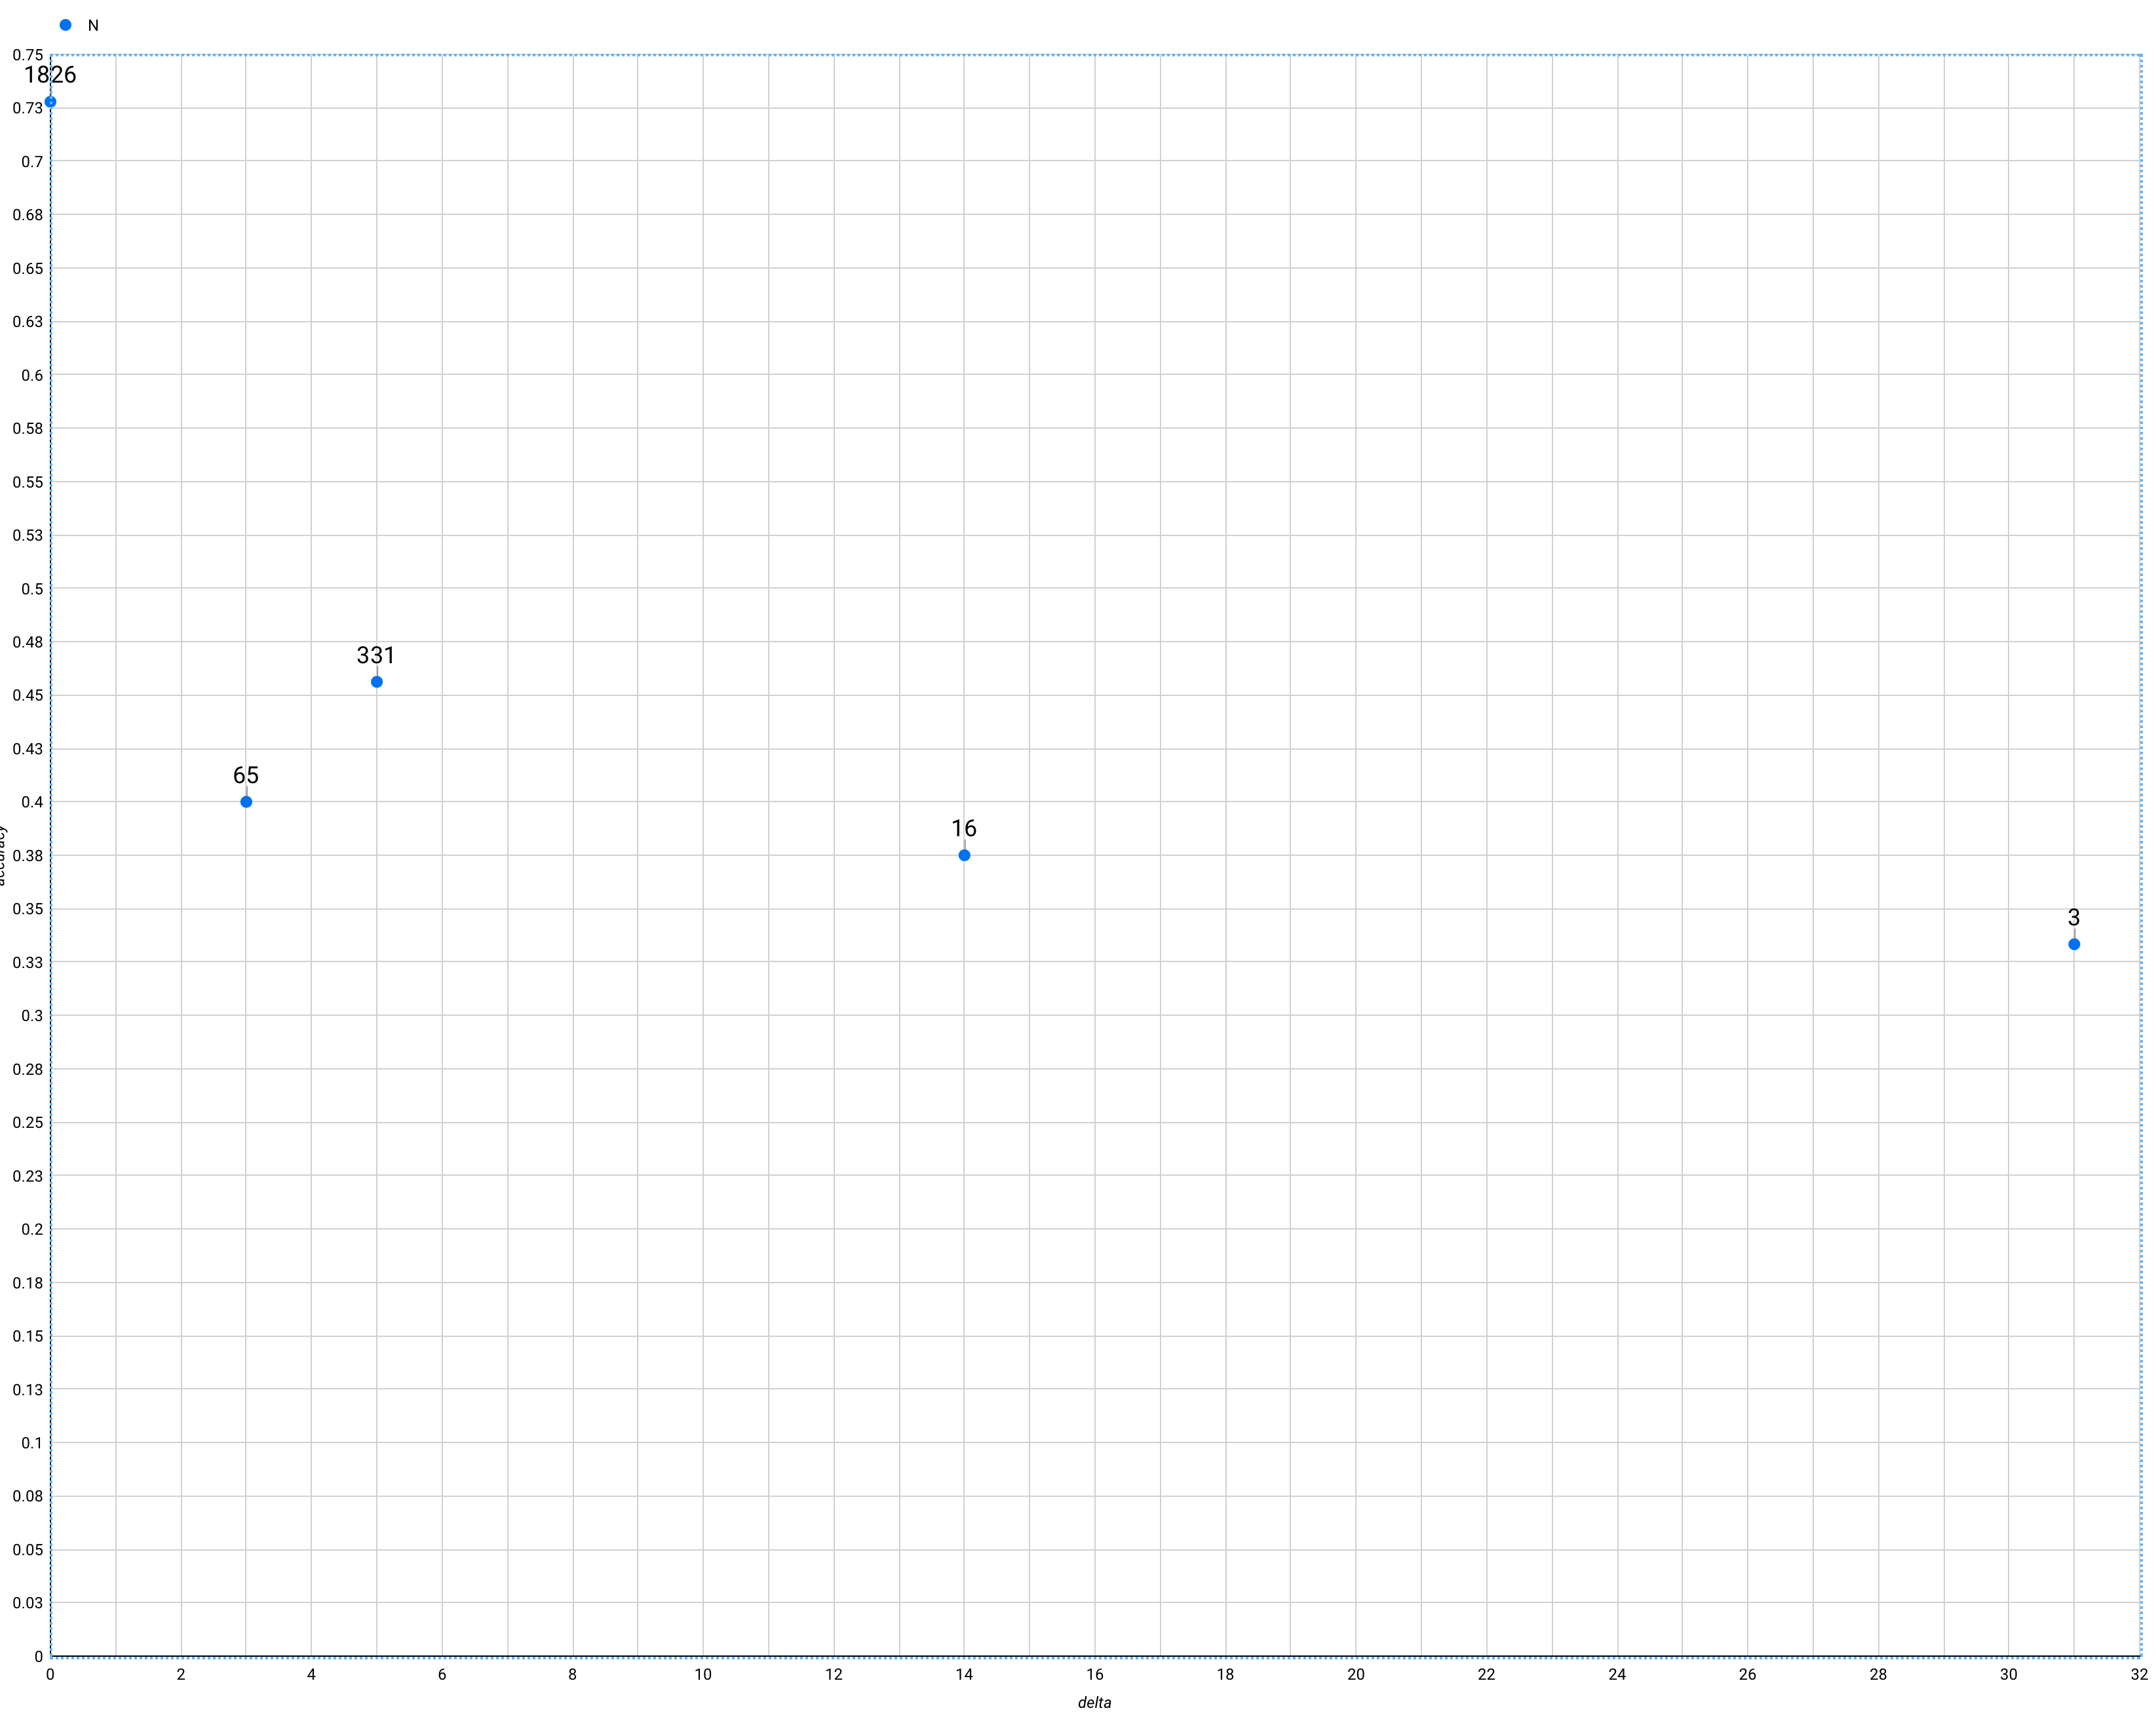
A next good thing to look at would be the forgetting curves of known-hard questions, but we don’t have enough data yet.
It’d also be good to look at inter-user variation: do some users have much steeper curves? That could reflect differences in prior knowledge. The challenge here is that only 10% of samples are delayed e.g. to 14 days for each user. That’s not enough samples to really tell what’s going on. There’s going to be a lot of per-card variance. I could try to do a more complex multi-variate regression, but I’d need to think carefully about that. I’m not convinced I wouldn’t just be seeing noise. Looking informally at the data I have, it looks like inter-card variance is larger than the differences induced by delays.
Maybe better to look by card, then. But to do that I’ll need to wait for a lot more data. Right now we only have enough for a few 2-week samples per card.
Looking again at efficacy data… trying an analysis I saw in a bunch of the cogsci papers: show the total proportion answered correctly, with the standard error. This produces (query):
- control: 0.92 (0.01)
- delayed 1 month: 0.68 (0.03)
I don’t really understand what the standard error is saying here. This doesn’t strike me as doing a great job of describing the results. I guess that’s because it’s trying to talk about the “typical reader,” whereas the actual results are quite skewed. The standard errors don’t seem to correspond to reality. I think maybe what it’s really saying is: “68% of the time, the true population mean falls within these bounds.” Which is not saying much. Wikipedia confirms this suspicion.
Incidentally, Cohen’s d (“large,” in this case):
n1 = 91
n2 = 77
s1 = 0.13404594087330865
s2 = 0.2709536175981917
m1 = 0.9218559218559218
m2 = 0.6796536796536796

pooled = sqrt( ((n1 - 1)*s1^2 + (n2 - 1)*s2^2) / (n1 + n2 - 2) ) => 0.2082

d = (m1 - m2) / pooled => 1.1632
I’d still summarize this by talking about the behavior of individuals: most people forgot at least a third of the material after a month without review; with review, most people forgot nothing when tested at the 1-month mark.
Yesterday I started looking at attempts before a correct answer, trying to look for some kind of a regime change that represents “learning.” There are a bunch of questions which take people several tries if they didn’t know it initially. But how can I characterize what happens afterwards? I can try something like: in the subsequent N repetitions, how many correct answers did they give?
We already know that people won’t perform perfectly—the accuracies on leech questions demonstrate that. But maybe when a question has 75% accuracy, each person is only forgetting it once every several attempts (rather than some people forgetting every time). Query
John Preskill question: the median user who forgot it on their first attempt remembered it on their 4th attempt. The knowledge appears to be sticky after that: 2/3/3 of the next 3 repetitions were correct (25th / median / 75th %ile). Same phenomenon with “The net effect of a quantum circuit of CNOT and single-qubit gates is to effect a ___ operation on the state space of the qubits.”, Shor’s algorithm, names for the dagger operation. These prompts are all highly declarative.
“What is the length of $|\psi\rangle$ in the Dirac notation?” and backwards CNOT are less steady: 2 / 2 / 3 correct in next 3.
Matrix rep of Z and Hadamard prompts are even less steady: 1 / 2 / 3 correct.
These are interesting point samples. What’s a more general representation?
- after a lapse, how long are people able to remember things before they forget again?
- *
What happens if I start by looking at readers who didn’t initially know the answer to a prompt? Those are people who definitely didn’t know the material before they read the piece, and who clearly came to remember the material in the course of the review sessions.
Can I spot a “phase transition” in their performance—i.e. they reliably answer incorrectly for several sessions, then reliably answer correctly? i.e. is there some approximation for someone having “learned” a given piece of material?
I already know that this isn’t really how “leech”-type questions work: because they have low-ish accuracies even at higher intervals, people must be forgetting the answer after having already answered correctly. Still, I suspect there’s something to be found in the sequence of hits/misses.
Working on how to state that more analytically. For people who answer a question incorrectly the first time (and who answer it at least 5 times):
- how many tries do they need before they remember the answer?
- in the subsequent 3 repetitions, how many times did they answer correctly?
Started looking at this question: query
What happens to readers’ memory when they review a question?
I’ve spent ~25 hours the last two weeks trying to frame and answer various angles on that question. I’m trying to eschew models and complex assumptions as much as possible. I’ve figured some things out… but many thousands of words of notes and many dozens of queries later, I’m also pretty stuck. I feel distinctly that I’m not slicing with the right knife, but I’ve not yet been able to find a good one.
Here’s what I’ve got:
Our data as a whole tells a very noisy story, but it becomes much clearer once you slice by question: there are three distinct but consistent regimes (query):
- Easy “one-shot” questions (the vast majority), like “What’s HH?”:
- Almost everyone remembers these initially. With each repetition, the fraction of readers who remember the answer slowly increases, even as the intervals roughly double. Those fractions increase roughly in inverse proportion to their magnitude: they increase often several percentage points per repetition under 95% and decay from there, stabilizing for most questions around 97-98%.
- For more than three quarters of QCVC’s questions, most users had zero lapses in the first six repetitions. (query)
- The “lived experience” interpretation, for me, is that this is the stuff you basically “get” after reading it once. Some reinforcement is necessary, but there’s no real struggle. (More on the counterfactual later)
- Trickier “uphill slog” questions: (about 1/3 of QCVC), like “What’s the name of the quantum factoring algorithm?”:
- Many or most people forget these answers. But with each repetition, a much larger fraction of readers remember the answer. After half a dozen repetitions, the fraction stabilizes at around 85%—a bit lower than the easy questions—even as the intervals continue to increase.
- Slicing by user, it’s not that 15% of users are forgetting 100% of the time—more like most users basically always remember, and a minority remember much of the time.
- This maps onto a type of question in my experience which acutely feels like I’m learning it as I review. The increasing intervals are a bit of a struggle, and I’ll lapse a few times; it’ll often feel like the answer’s on the tip of my tongue, but eventually I build confidence and stability.
- Leeches (about 6 questions in QCVC), like “What’s the matrix rep of Z?”:
- Many or most people forget these answers. The first few repetitions increase the fraction of people who can remember the answer correctly, but that plateaus below 75% and declines as the intervals increase.
- In a real sense, QC doesn’t “work” for these questions: we’re not able to reliably stabilize recall at long intervals.
- This maps onto a type of question in my experience which feels like I can never really get my arms around it. It needs to be broken down further, or connected more to prior knowledge, or maybe I just don’t care about learning it.
- The unifying observable here is something like a “stabilization point”: given a particular schedule, how reliably does a question stabilize as intervals increase? “Easy” questions stabilize with near-total reliability for basically everyhone; “uphill slog” questions stabilize as intervals increase, but with markedly lower rates; leeches don’t reliably stabilize (but probably would with a different schedule).
- (I’ve controlled for survivorship bias in all of the above by only looking at users who completed e.g. 6 repetitions for all their cards)
You’ll probably forget stuff if you don’t review, and this is more true for harder questions.
- It’s hard for us to say much about this in general. Leeches and uphill slog questions do have a visible forgetting curve, but “easy” questions basically don’t, so it’s hard to distinguish causes.
- Our schedule change lets us evaluate the counterfactual across all questions, since the first repetition moved from 1 day to 5 days. And indeed: waiting a few extra days tended to drop performance: perhaps a couple percentage points for easy questions, and 5-10pp for harder questions. (query)
- Our current RCT suggests that most people will forget about a third of what they read after a month… but 6 of those 9 questions are in the “easy” bucket. The other 3 are “uphill slog” questions. Looking just at those, most of our delay1Month users could answer <= 1 question, while most of our control users could answer all 3 (query).
I’m really struggling to push this analysis further. Some of the things which are making this hard:
- The vast majority of QCVC’s questions are so easy for people that there’s very little entropy in their data—which was making it harder for me to see the interesting data in the minority of “interesting” questions.
- For more than three quarters of the questions, most users had zero lapses in their first six repetitions. (query)
- Even in the tail, there aren’t many lapses: in repetitions after the third:
- 72/112 questions are remembered correctly by 95%+ of readers
- 88/112 questions are remembered correctly by 90%+ of readers
- 107/112 questions are remembered correctly by 80%+ of readers
- (query)
- We could still find some signal in this data if we had millions of readers, but by repetition 6, we’ve got about 300 original-schedule readers sticking around, which gives us <15 lapse samples for most questions at each repetition.
- Our fixed schedule makes it very difficult to disentangle time from repetition number. You’ll notice that in my analysis of question types above, I talk about accuracy rates changing with each repetition… but there’s another independent variable—time!
- I want to be able to describe a time-dependent relationship, but I don’t know how to do it using our data without introducing some exogenous model.
- The frequentist approach—just looking at how many users were able to answer correctly in a given bucket—becomes meaningless in the face of survivorship bias in many common situations.
- I spent a bunch of time reading how others analyze these types of systems. I’m pretty skeptical about all these approaches—they tend to assume exponential models of both stabilization and forgetting, then fit parameters, and then describe how the data behaves relative to their finely-tuned models. I don’t dig it!
- One big advantage we have over, say, SuperMemo’s analysis is that we have data on many distinct users answering the same questions. Piotr only has one data point for each question at each repetition, which more or less demands that he fit the behavior of a given question to some broader model. But we don’t have to guess about an item’s difficulty based on fit to some prior curve: we can look at the relative proportions of users failing in a given situation.
- The vast majority of QCVC’s questions are so easy for people that there’s very little entropy in their data—which was making it harder for me to see the interesting data in the minority of “interesting” questions.
- Taking a slice at the sixth repetition, for instance (original-schedule users):
- For more than three quarters of the questions, most users had zero lapses in those first six repetitions. (query)
- Even in the tail, there aren’t many lapses: in repetitions after the third:
- 72/112 questions are remembered correctly by 95%+ of readers
- 88/112 questions are remembered correctly by 90%+ of readers
- 107/112 questions are remembered correctly by 80%+ of readers
- (query)
- We could still find some signal in this data if we had millions of readers, but by repetition 6, we’ve got about 300 original-schedule readers sticking around, which gives us <15 lapse samples for most questions at each repetition.
- The obvious question about all these questions, since readers remember them so reliably, is: would they have remembered them so reliably without reviewing? Performance is so high that the forgetting curve is basically invisible, but I think we’ll be able to observe this by comparing old-schedule and new-schedule readers. ==TODO==
- What is the effect of repetition on more challenging questions?
- analyze increase in accuracy with each repetition
- how to avoid bias? compare accuracy rates for a given interval and a given repetition within users doing that repetition
- can’t do that because the accuracy rate would be 0 among those questions in the prior repetition
- e.g. in repetition 2, user X answered Y% correctly; in repetition 3, that user answered Z% correctly
- perhaps within a pool of a-priori comparable questions
- the thing I don’t like about this is that repetition 3’s intervals are quite different from repetition 2’s: some have doubled; some have halved.
- one interesting comparison to make might be to look at “attempts” at clearing a particular interval
- e.g. 70% of users clear it in 1 attempt; 88% of users clear it in <= 2 attempts; 95% in <= 3 etc;
- Really getting nowhere here. Maybe better to more simply look at accuracy vs repetition across questions.
Easy vs. hard prompts
Of users who did 6 repetitions (query, counts query)
First repetition (85 under 95%, 49 under 90%, 22 under 80%):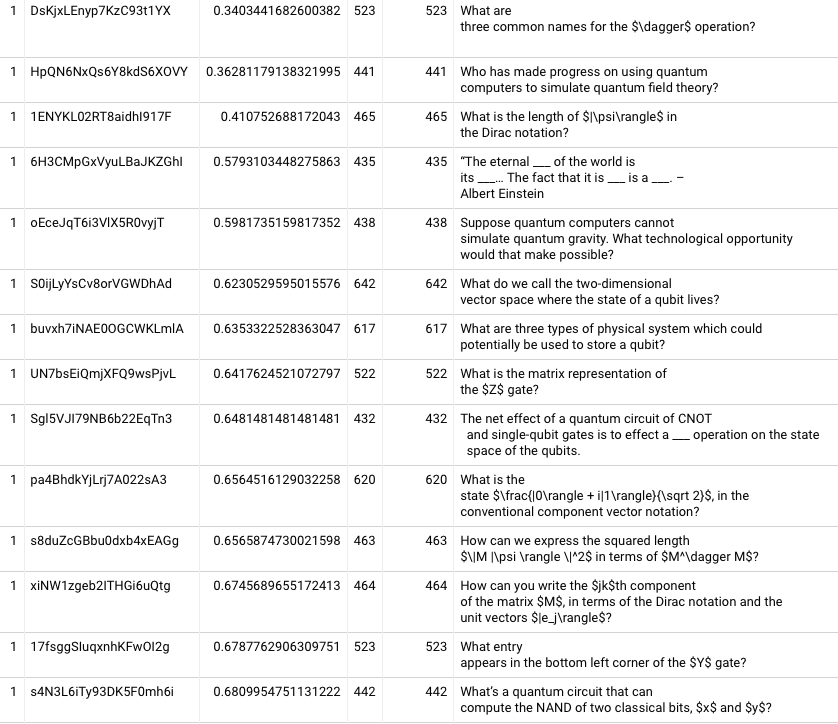
Second repetition (85 under 95%, 55 under 90%, 29 under 80%):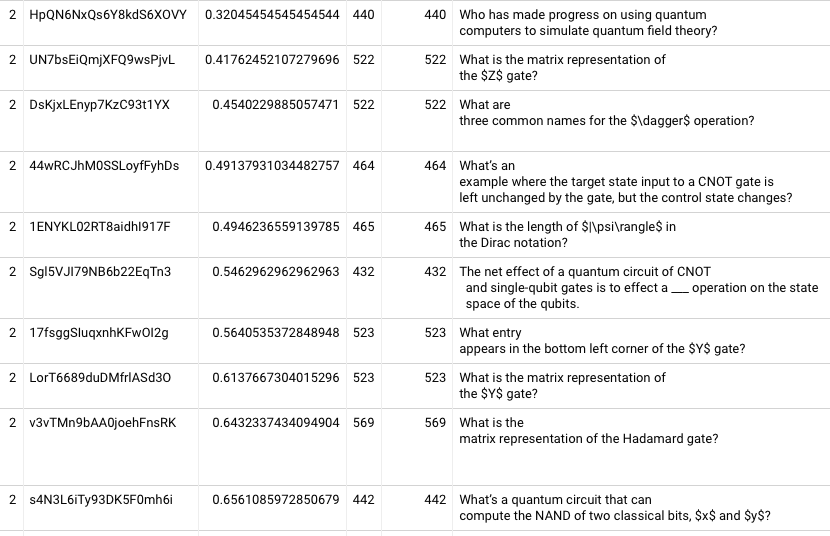
Third repetition (55 under 95%, 33 under 90%, 10 under 80%)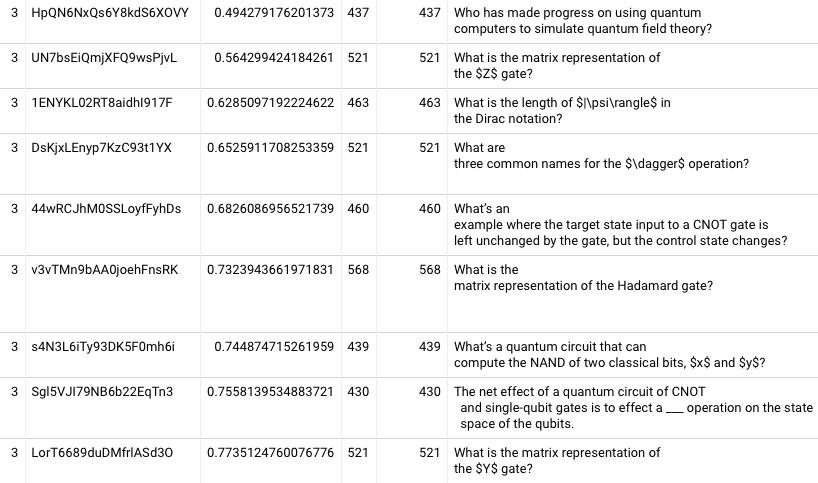
Fourth repetition (40 under 95%, 24 under 90%, 5 under 80%)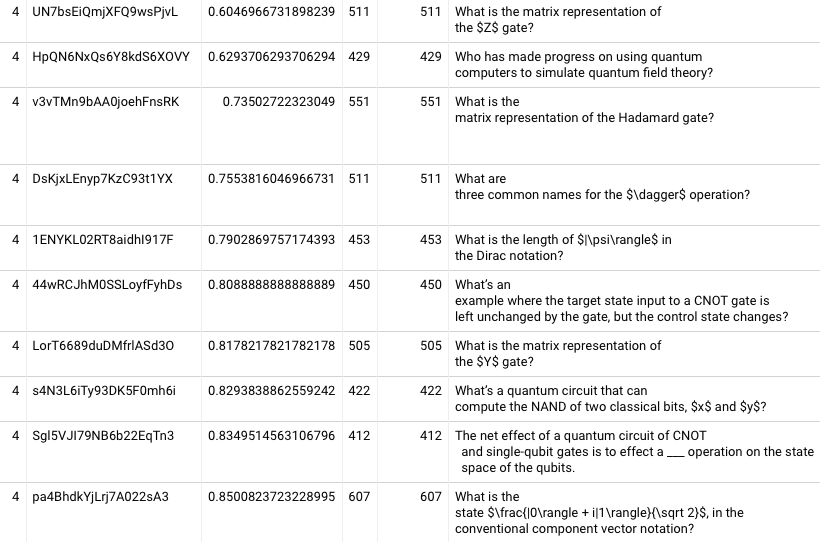
Fifth repetition (38 under 95%, 20 under 90%, 5 under 80%)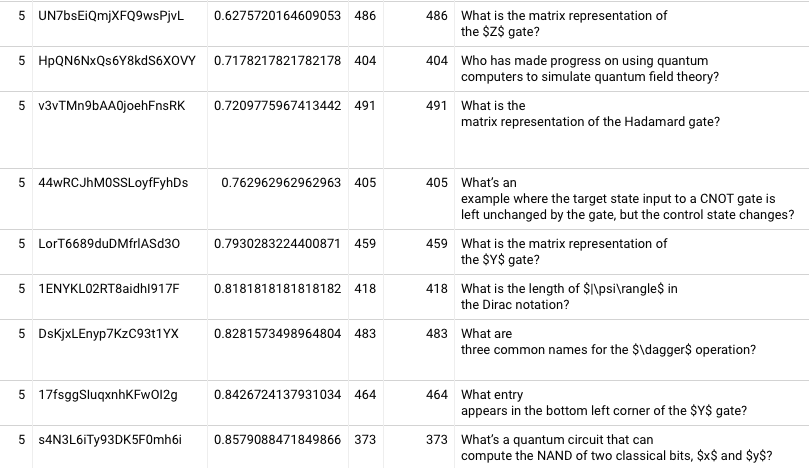
Sixth repetition (39 under 95%, 18 under 90%, 3 under 80%):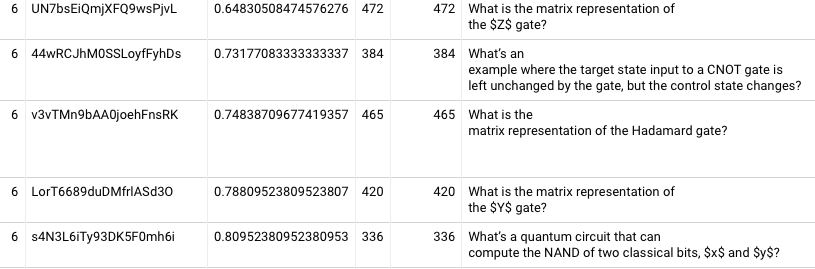
For 87 of QCVC’s 112 questions, most users had zero lapses in the first six repetitions!
We can see, though, that some questions remain stubbornly forgettable even after many repetitions. What about the questions in between?
On my way to Sea Ranch yesterday, I was thinking through how I might make retrievability / stability measures without assuming a model a priori.
Relative to Piotr’s work, one interesting advantage we have with Quantum Country is that we have data on a large number of people working through a shared set of questions. Piotr’s algorithmic work has drawn on a single individual’s performance across a large number of questions. For a given repetition of a question, he can only ever have one data point. This makes it hard for him to distinguish between timing-specific effects and question-specific effects. If a particular question decays with a different curve, that would be hard to observe, since he has very few per-question samples.
Because Piotr only has a single binary data point for each repetition, he’s forced to use models to establish higher-order values like “retrievability.” But we have many samples for each question’s repetition… so can we avoid a priori model assumptions? Can we use a frequentist approach?
One idea: maybe we can compute the retrievability of a given question at a given repetition # at a given interval by looking at how many people answered it correctly with those parameters. The problem with this approach is that if 60% of people answered a question correctly with those parameters, that doesn’t mean that any individual's probability of correct recall should be modeled as p=0.6. A better model is probably something like: 70% of users will remember the answer with p=0.9 and 30% with p=0.1. We can’t really distinguish between the two, I think. That’s probably fine if we’re only comparing these measures to each other, so long as we can control for bias in the populations. If we say “at this time, 70% of people answered correctly and at that time, 60% of people answered correctly,” any differences should be attributable to shifts in underlying recall probability (whatever that means).
That approach might let us explore what kind of forgetting curves we observe in practice. Are they exponential? Power law?
I notice that I don’t really understand what Piotr is depicting in his forgetting curve diagrams. I’ll take this morning to understand that. See:
Supermemo’s approach depends heavily on models and regressions. I’m skeptical of the whole thing! Can I take a frequentist approach to this stuff?
Retrievability seems to be the easiest thing to approximate. I should give that a shot:
Do I see a forgetting curve?
Segmenting by repetition, what fraction of users in each day-bucket were successful? I’ll begin by only using users who had zero lapses, and I’ll use original-schedule users. Query
- The first repetition seems to show a pretty clear decay effect, though it’s not at all clear that it’s exponential (bubble size varies with count)
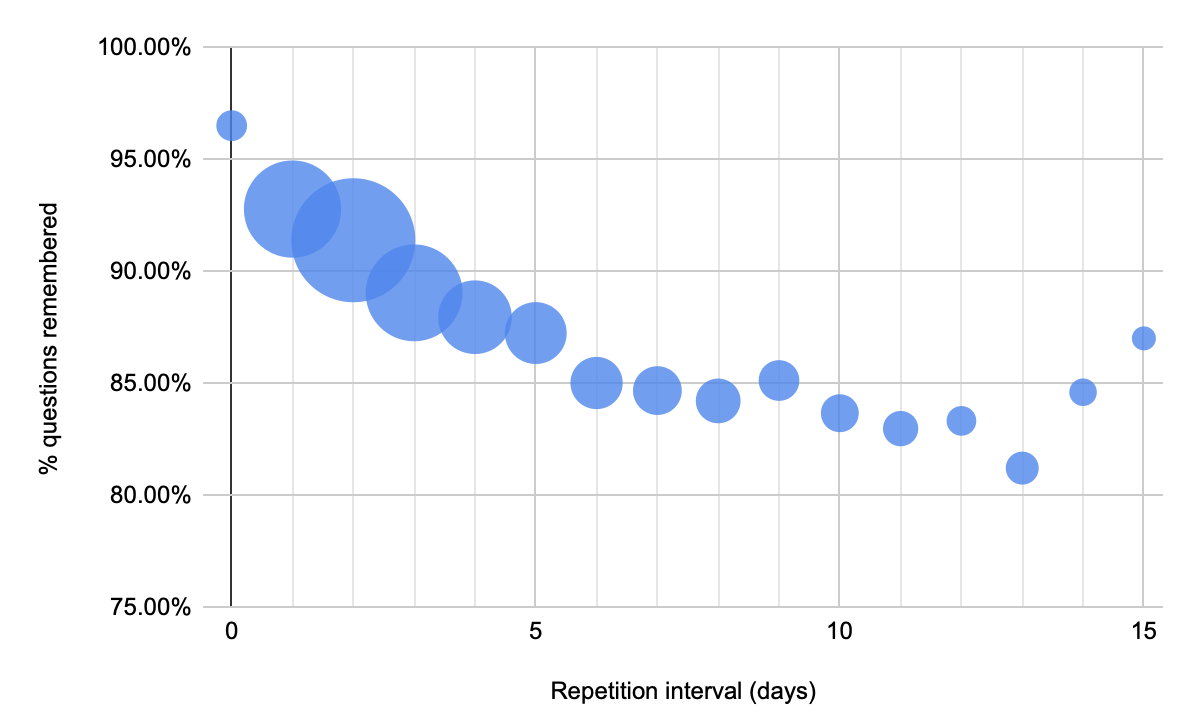
- The next repetition’s decay effect is quite muted by comparison (red is the 3-day repetition in the original schedule):
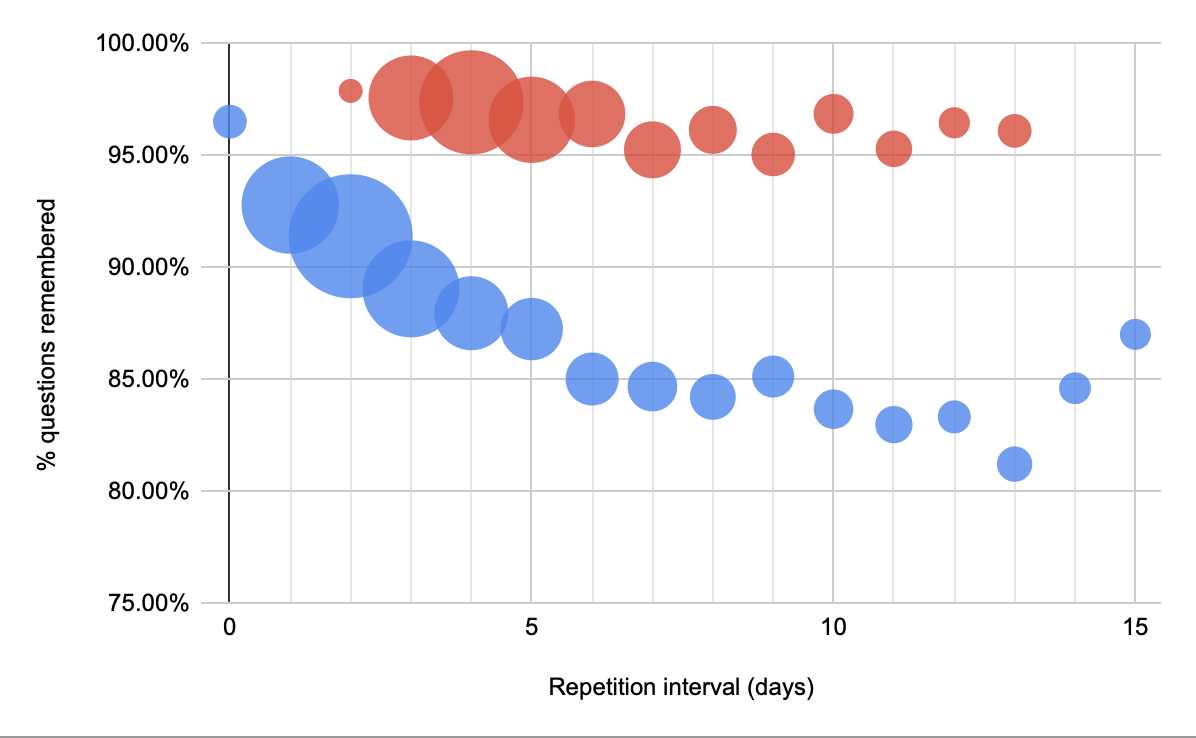
- 1-week reviews barely seem to decay:
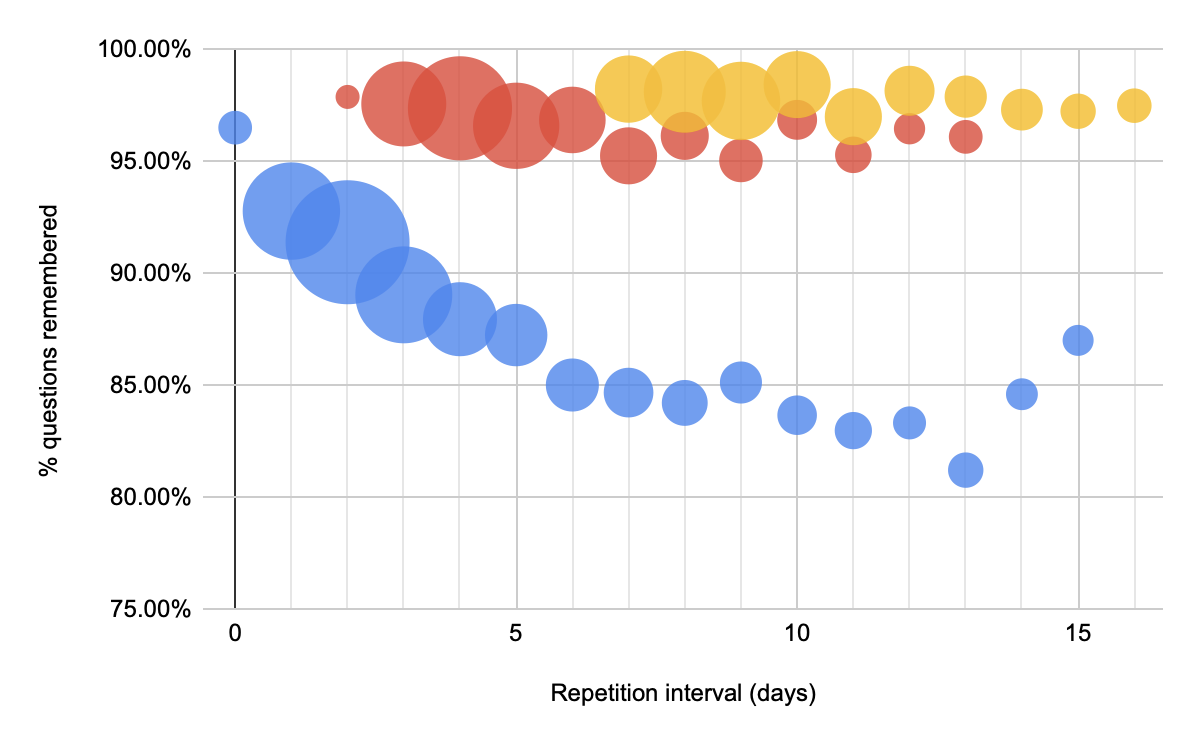
- Ditto 2 weeks (green) and 1 month (orange):
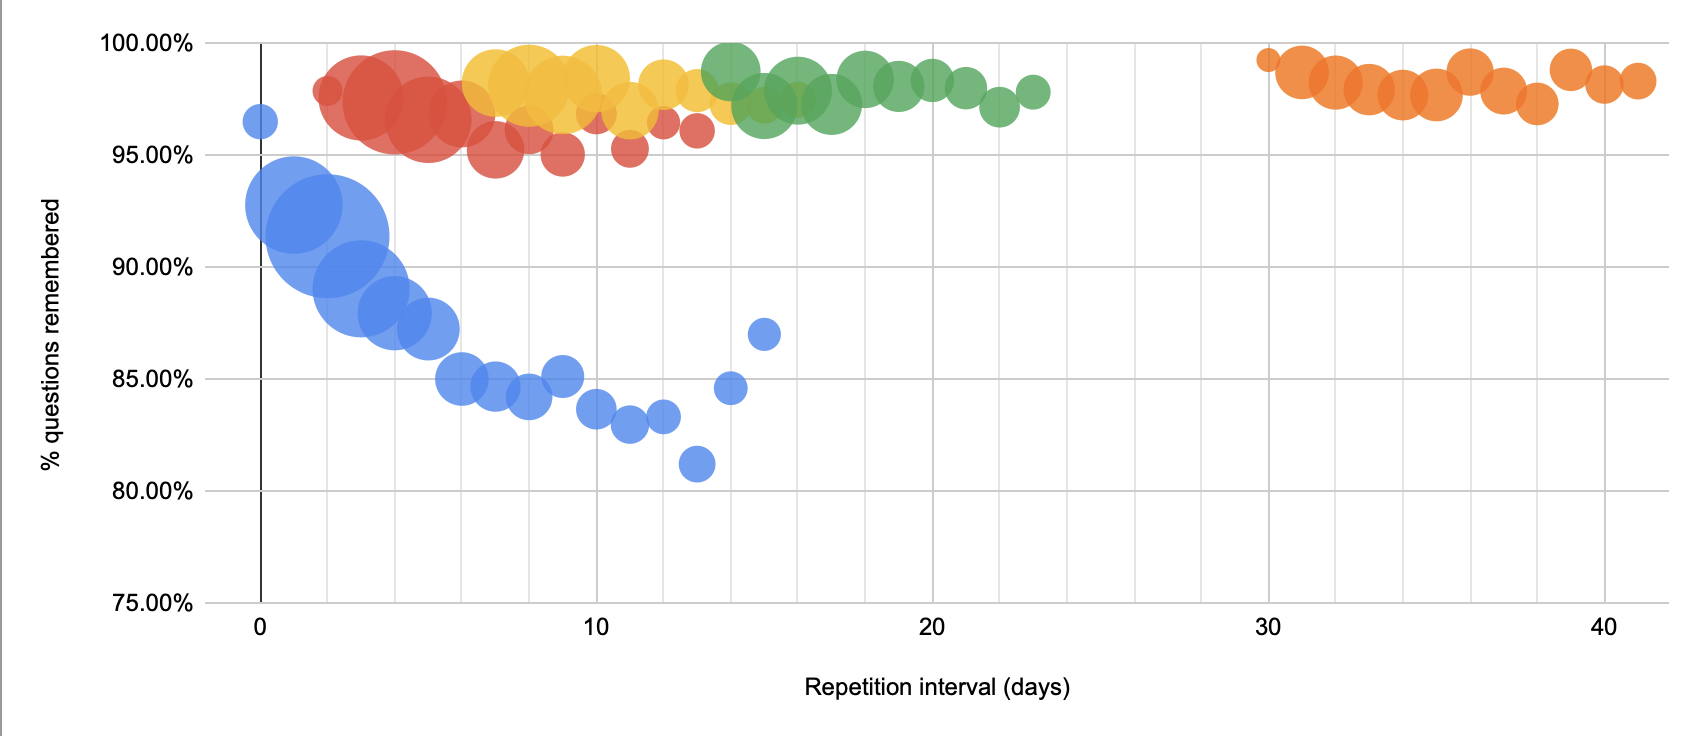
Maybe we don’t see a real decay because we’re only looking at the subset of reviews which never had any lapses. Each repetition’s survivorship bias pushes stability up.
How can I consistently look at memory decay without that assumption?
Among the hardest 5 prompts, I see more consistent forgetting curves (query):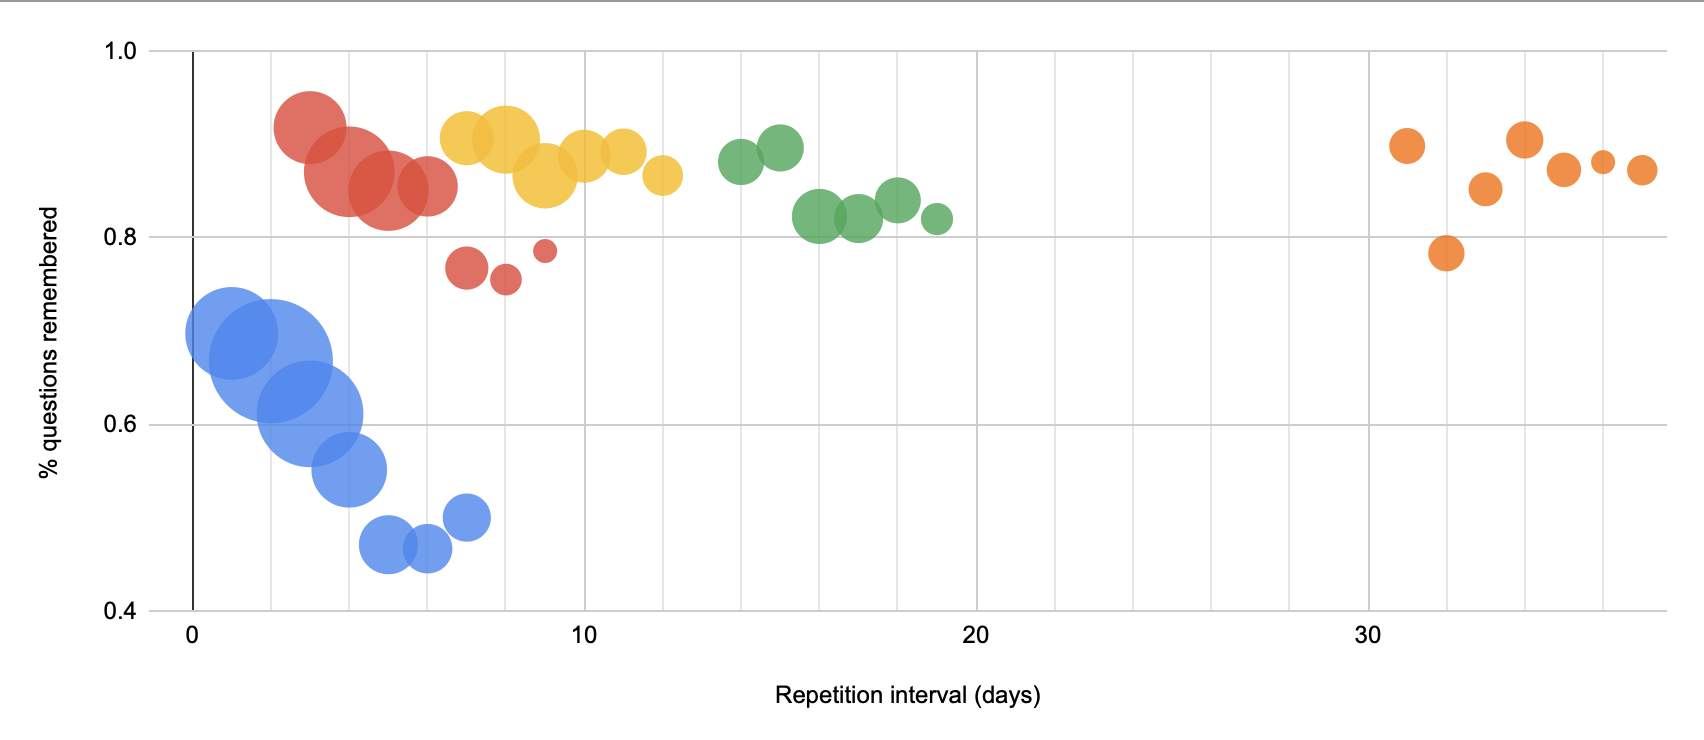
Ideas for including more samples and seeing decay at higher repetition intervals: mix stabilities, normalize time (e.g. as U Factor)… OK, we can try it for a given repetition number and see how the differing number of lapses compare.
Here’s that for the 5 hardest questions (query):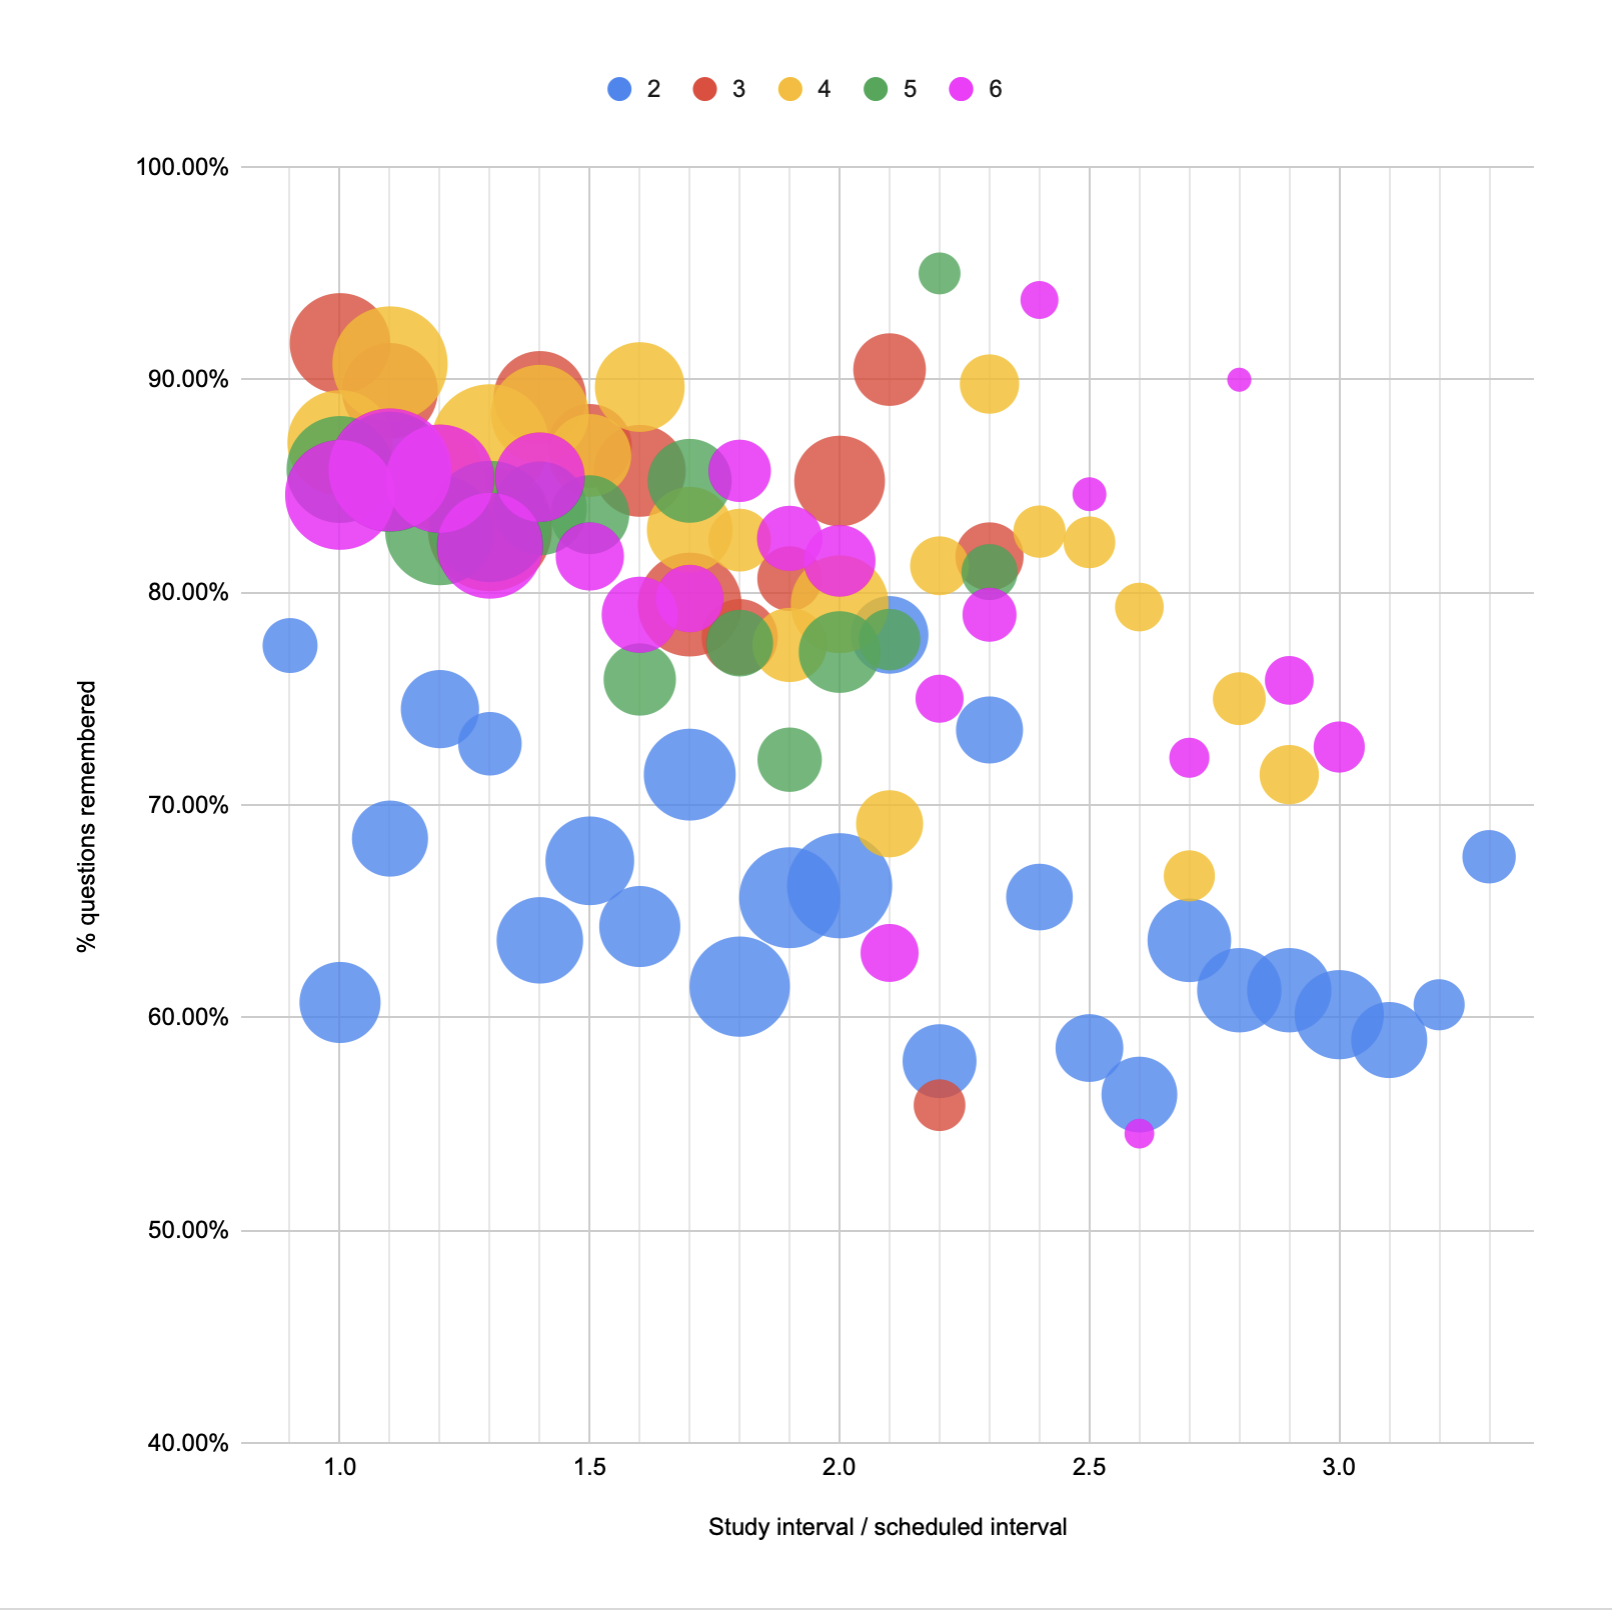
This produces clearer decays, though they still look mostly linear.
Some prompts are clearly much harder than others
We have a number of prompts which are clearly and discontinuously much harder than the others. People answer them correctly in their first session at a low rate, and accuracy remains low as the intervals rise.
Sebastian wonders: does this mean the first-session response rates can reliably be used as a leading indicator for such questions? This would be a meaningful tool for authors if so.
More specifically, the thing to check would be: are there questions which have low first-session accuracies but higher later-session accuracies?
Sanity check: what is our typical forgetting index, anyway?
Deciles:
0.0
0.6595744680851063
0.7692307692307693
0.8333333333333334
0.88
0.9183673469387755
0.9444444444444444
0.972972972972973
1.0
1.0
1.0
OK, seems reasonable. So the median session has 92% accuracy; the 80th percentile is 100%; the 20th percentile is 77%. Query
How many errors do people make on the hard questions in 4 repetitions?
Among the 424 original-schedule users who reviewed all 5 hard questions, their per-repetition accuracies mostly rise over repetitions 2-5, from 15% to 60%. (query)
In those first 4 repetitions, the median user forgets each of those questions once; a quarter of users forget none of them; the bottom quarter forgets each question 1-2+ times. (query)
(writing to Michael—but I didn’t end up actually sending it):
I’ve spent many hours this past week asking and answering questions, trying to understand what’s happening. I’ve thrown most of it out, of course; here’s the best I’ve got at the moment:
Repetition increases recall rates of hard prompts
- v3vTMn9bAA0joehFnsRK: up from 5 days to 2 weeks, down at 1 month
- LorT6689duDMfrlASd3O: ditto
- 44wRCJhM0SSLoyfFyhDs: yes
- 17fsggSIuqxnhKFwOI2g: yes
- [query]
Pooling them, we see this pattern among the hardest five prompts (all users):
- 5 days: 48% (N=1177)
- 2 weeks: 68% (N=457)
- 1 month: 76% (N=177)
- 2 months: 83% (N=56)
Among new-schedule readers who have answered all five prompts at the 1 month level (N=61; query):
- (in-text: 84%)
- 5 days: 57%
- 2 weeks: 74%
- 1 month: 79%
Among original-schedule users (N=168; query):
- (in-text: 81%)
- 1 day: 72%
- 3 days: 89%
- 1 week: 88%
- 2 weeks: 86%
- 1 month: 79%
Note that they have a much higher pass rate at the 2 week level, presumably because they’ve done 2 more repetitions prior to that point.
There are enough of these users that we can look at the subset of them who answered all these prompts at 2 months. The story’s mostly the same (N=73; query):
- (in-text: 82%)
- 1 day: 78%
- 3 days: 90%
- 1 week: 90%
- 2 weeks: 88%
- 1 month: 87%
- 2 months: 82%
The number of repetitions needed to remember these hard prompts at a given interval also falls with more repetition. The 10th %ile reader needs 3 attempts to clear 5 days, 2 attempts to clear 2 weeks, and just 1 attempt to clear 1 month. (query)
How autocorrelated are users? Are these probabilities which apply fairly uniformly to all users, or does the median user actually clear 1 month with no lapses? Query
- To clear 5 days for these 5 prompts, the median user has 4 lapses
- 2 weeks: 5 lapses
- 1 month: 5 lapses
The typical prompt is boring
The story of a typical prompt appears to be maintenance.
I think I know how to look at what happens to accuracies over time, while avoiding survivorship biases of either readers or questions. The plan is to look at each repetition’s accuracy rates for a single question (a hard one), bucketed by interval. So, for instance, I’ll compare second, third, and fourth repetition accuracy rates at various intervals. I may also bucket by attempt number, to distinguish readers who are attempting to increase their interval from those who are regressing from a higher interval. If the medium’s working the way we hope, we should see within-interval repetitions increase in accuracy rates; cross-interval repetitions should be steady or increasing.
Query for “matrix rep of Hadamard”
- This is less revealing than I’d hoped.
- The “happy path” is mostly stable, though not strictly increasing. Going from 3 days to 1 week has a 5pp drop. Other than that, it’s stable.
- The rest of the data is pretty messy. I was hoping to see that with each repetition, the likelihood of a correct answer (at any interval) goes up, but that’s not obviously true. It’s also not obviously not true: I just don’t really understand what’s going on here.
- The hypothesis is that repetitions reinforce memory. This data doesn’t clearly support that hypothesis, but it’s awfully hard to tell because we’re simultaneously seeing the impact of repetitions and also the impact of increasing intervals.
OK, another angle:
- What fraction of users who’ve attempted a given recall interval have succeeded in reaching that interval, with each repetition?
- With hard prompts (matrix rep of Hadamard gate), the proportion of users who’re past a given interval doesn’t clearly increase with repetition count (query)
- With easy prompts (“|psi> is an example of a __”), the accuracies start high and stay that way (query(https://console.cloud.google.com/bigquery?project=metabook-qcc&j=bq:US:bquxjob269b4d50_172ecd55d76&page=queryresults))
- With “medium” prompts (“who made progress on QC to simulate QFT?”), the behavior is somewhat in between (query)
- This isn’t a great way to slice the data because now the later repetitions are dominated by people who did many rapid repetitions back-to-back.
- One thing this does tell me is that repetition alone isn’t going to cut it.
One metric that seems interesting: how many attempts do people take to clear a prompt at a given interval?
From my walk, the story that’s emerging:
- most questions are pretty uninteresting: people get them right at first, and mostly keep getting them right
- but some questions are clearly challenging for a large swath of people; those questions are more instructive
- for those questions, the story is one of increasing accuracy with repetition, even as the intervals get longer
- but the behavior is bimodal: a substantial slice of people are never able to remember these questions at all
- How can I fix the denominator problems in my earlier analysis of first-response accuracy rates?
- The concern with not requiring complete response sets is that your counts for the later intervals disproportionately represent easy prompts.
- But if you require complete response sets, you select for the successful readers.
- OK, so one clear alternative is to intentionally look at the evolution of a known-hard prompt. Here are the accuracies for “matrix rep of Hadamard” for original-schedule users who eventually answered that question at the 1-month level (query; N=293):
- 1 day: 80%
- 3 days: 88%
- 1 week: 86%
- 2 weeks: 90%
- 1 month: 76%
- The same query for original-schedule users, without the suvivorship condition:
- 1 day: 78% (N=95)
- 3 days: 91% (N=130)
- 1 week: 82% (N=107)
- 2 weeks: 80% (N=103)
- 1 month: 78% (N=81)
- The first query, among aggressiveStart users:
- 5 days: 63% (N=27)
- 2 weeks: 76% (N=33)
- 1 month: 95% (N=22)
- The second query, among aggressiveStart users:
- 5 days: 59% (N=157)
- 2 weeks: 66% (N=76)
- 1 month: 95% (N=21)
- The general pattern holds among the other “hard” cards.
- What do I make of this?
- It’s really hard to separate the survivorship effect from the practice effect.
- Looking at these “hard” prompts seems like a productive avenue, but I think I’m taking the wrong measure. What I actually care about is: do repetitions produce more reliable memory? But the independent variable here is prior recall success.
- I think it’ll be more productive to look at repetition traces. That is: do accuracy rates rise with repetition, at the same interval?
- There’ll be an anti-survivorship pressure. Bluh.
- What if I just look at raw indices: you repeated it; are you now more likely to remember (at whatever interval)?
How can I characterize “maintenance mode” vs “development mode”? I guess that in maintenance mode, you can go for long periods between reviews with a low rate of error.
- Maybe we can detect this by looking at questions with a high rate of error.
I queried the accuracies of the first try at each level, over users who’ve answered 90% of their prompts at 2 months. Some observations:
- “What is the matrix representation of the Hadamard gate” has only a 74% success rate on the first try at 1 month. Similar with the Z and Y gate-specific questions—those are the only prompts with accuracies under 80% at 1 month, at least for users with the original schedule. Very similar accuracy rates at 2 months—could readily be the same distributions, given the sample sizes we have. Not really enough data at 4 months for me to trust it, but it looks like it’s pretty similar.
- Accuracy rates at 1 month are roughly the same for new-schedule users, even though they had two fewer repetitions early on.
- Card IDs people struggle with:
- v3vTMn9bAA0joehFnsRK: matrix rep of Hadamard
- UN7bsEiQmjXFQ9wsPjvL: matrix rep of Z
- LorT6689duDMfrlASd3O: matrix rep of Y
- 44wRCJhM0SSLoyfFyhDs: example of inverted CNOT
- 17fsggSIuqxnhKFwOI2g: bottom left corner of Y
- (there’s a 5+% gap between these q’s and all the others, which have ~90%+ accuracy)
- Looking at the population of who have answered 90% of their prompts at 2 weeks, the numbers become more stark: 63% for inverted CNOT; 63% for matrix rep of Z; 68% for matrix rep of Hadamard; 69% for matrix rep of Y. (N=200-234 among aggressiveStart)
- presumably the gap between the figures for these populations indicates substantial survivorship pressure
- these numbers are substantially better for original-schedule users, who had 2 more reps before this point. this may be survivorship pressure as much as repetition effect.
Digging into specific user experiences for “matrix rep of Hadamard”: query
- user 24Z6qm30A8YM9FWi3k1hpWA8ngG3 thrashed on this question for 3 months but ended up still at level 1 after 17 repetitions
- user 3uJvcLP87pWZ0oNGaWor7xl7zA53 rose from 5 days to 1 month, but couldn’t remember at 1 month and fell back to 5 days. But then they rose back to 2 months with no lapses.
- user 59maOhQgEgREHAkDWBsbo40ntie2 took 17 repetitions (over 8 months!) to make it past the 2 weeks level
- lots of stories like these, though of course more straightforward stories of people mostly remembering
I realize now that my 2002-06-19 queries aren’t valid because of heavy survivorship bias: of course I see 90%+ rates for the higher levels, since I’m selecting from the population of users who answered 90%+ of their questions at 2 months. Also I was computing rank incorrectly, so my samples were including subsequent correct answers.
I tried to ask: how many repetitions does it take to correctly answer a prompt at a given level? The answers are somewhat rosier than the accuracies above: among original-schedule users, the worst-case question is the matrix representation of the Z gate. The median user has just one wrong response prior to recalling the answer at a 2 week interval. The 20th percentile has three wrong responses.
- Among aggressiveStart users, it looks even better: the worst-case question is inverted CNOT; the median user has no wrong responses prior to a correct answer, and the 20th percentile has one wrong response.
- But in both cases, I’m selecting from a pool of users who eventually answer those questions correctly at a 2-week level.
- Do memories always stabilize?
- If someone misses a prompt a few times, do they always end up able to remember it correctly eventually?
- If I’ve answered a prompt successfully a few times, do I basically “have” it?
- Do some questions hit a recall ceiling?
- i.e. Many people are never able to remember them past X interval?
- To put this another way, do some questions take many more repetitions for most people to clear certain intervals?
- What are lapses? Why do they happen?
- Are they predictable by prior data? (response time)
- If you lapse once, are you likely to lapse again?
- Are lapses more likely to happen in earlier or later repetitions?
- Do there seem to be two separate phases—an initial stabilizing phase characterized by poor accuracy rates, followed by a period of maintenance in which lapses are rare?
- How often do lapses immediately follow other lapses, vs. follow a prior string of successful responses?
- Do exponential forgetting curves actually describe our data?
- When a review is delayed for several days by our batching algorithm, does that actually impact accuracy rates?
- When we note that our readers have a 95% accuracy rate at the two month level, is everyone missing the same questions in that last 5%?
- If so, what characterizes those questions?
- If not, is that predictable from their prior performance on those questions?
- Are there people who stick around to try all their prompts at the two month level, but whose memory characteristics substantially differ from other readers’?
Do learning rates keep going up? It seems so. And they seem to mostly follow something like the forgetting curves.
I looked at the first response at any given interval and asked how often it was correct (Query). The initial percentages go up over time:
- 5 days: 86%
- 2 weeks: 95%
- 1 month: 96%
- 2 months: 96%
- 4 months: 98%
Part of what’s going on here, though, is that the later intervals are disproportionately including easy questions. One way to remove this bias is to only include samples from users who have completed 90+% of their prompts at a given interval level (Query):
- 5 days: 86% (650 users)
- 2 weeks: 95% (414 users)
- 1 month: 96% (160 users)
- 2 months: 98% (61 users)
- 4 months: 96% (7 users)
OK, so the pattern basically holds. The number of users rapidly dwindles, so it may be selection pressure, but we can get a larger sample by bucketing the few days around the due date. Our own batching smears things out more for the higher intervals.
Another problem with this analysis is that the later levels are mixing old-schedule and new-schedule users.
One way to explore how selection pressure shapes the curves: include only the users who have reviewed most of their set at some interval. (Query). Including only original-schedule users:
- 1 day: 93% (91 users)
- 3 days: 96% (84 users)
- 1 week: 97% (74 users)
- 2 weeks: 98% (75 users)
- 1 month: 98% (61 users)
- 2 months: 98% (61 users)
OK, so this cohort was doing a bit better to start with, but they still see a consistent climb upwards. Are the questions they’re still missing at 2 months consistent with the questions they were missing at 3 days?
Here’s the same query for aggressiveStart users who have mostly completed 1 month (Query):
- 5 days: 85% (63 users)
- 2 weeks: 93% (58 users)
- 1 month: 97% (33 users)
Here I’ve batched samples which fall within 10% of the due time (Query, among users who completed 90% of their prompts at >= 1 month):
- original
- 1 day: 93% (128 users)
- 3 days: 96% (142 users)
- 1 week: 96% (137 users)
- 2 weeks: 95% (207 users)
- 1 month: 96% (212 users)
- aggressiveStart
- 5 days: 85% (65 users)
- 2 weeks: 93% (66 users)
- 1 month: 97% (56 users) — same samples!
The story this is telling is mostly about maintenance. People who do the review sessions successfully retain the material. The difference will probably be starker if we look at the hardest questions.
Recall times and self-efficacy
In my own practice, I notice that quick recall often corresponds to my memory feeling quite “solid,” and slow recall often corresponds to feeling shaky. There’s some variation between questions, of course, but within a given question, the emotional arc of building confident recall roughly aligns with building rapid recall.
Just based on my own experiences, if I spent 10 seconds trying to recall an answer, then mark it forgotten, I often feel like I “almost knew” the answer. By contrast, if I look at the question and mark it forgotten after 2 seconds, I usually feel like I didn’t know it at all.
Do we see within-question recall speeds increasing over time? What’s the general relationship between interval, repetition, and recall speed? We probably can’t define a general curve, but we can maybe say something like: “With each repetition, readers remember answers 20% faster. After 5 repetitions, not only remember all the answers—they remember them in under a second (and this corresponds to subjective self-efficacy).”
Do recall times predict subsequent success? Like: if I mark a question as forgotten after 2 seconds, am I much more likely to mark it as forgotten next time than if I’d marked it forgotten after 10 seconds? If I mark a question as remembered after 2 seconds, am I much more likely to mark it as remembered next time than if I’d marked it remembered after 10 seconds? What are the exceptions?
If recall times are predictive, maybe we can use them to define some of the general relationships that are hard to access with our overly-discrete accuracy data.
Probabilities probably aren’t real—how can we ditch them?
Almost all the literature around spaced repetition (and related models like item-response theory) use recall probability as the dependent variable. The “forgetting curves” which people normally draw put probability on the y axis. That might work as a model, but I don’t think it reflects reality: is the underlying cognitive phenomenon essentially stochastic?
My (poor) understanding of the neurophysiology is that memory decay is a function of various environment-dependent processes. Those processes are roughly Poisson-ish, so a probability is a hazy way to describe the cumulative state of the system. Is there some way to ditch probabilities as a measure, to get closer to the underlying processes?
Is anything ever truly forgotten?
Say that I practice a question a few times, so that it becomes somewhat stable, and then I leave it alone for a really long time, until it feels quite forgotten. Then I test myself, mark it as forgotten, and review the correct answer.
Now, does the memory decay very quickly, as if I’d just learned it anew, or does it immediately regain a large fraction of its former stability?
To put it another way: does doing any review at all make it easier to recall material on-demand in the future, even if you might need a reminder at first? If so, that has powerful implications for these systems: for low-priority knowledge, you might want to review the questions a few times, just to get an initial encoding, then push them out a year+ for a refresher.
Based on initial rompts from Michael:
- What are the most important questions that can be answered with the data we have? What are the simplest and most powerful possible answers to those questions?
- “After 3 months, users of the mnemonic medium had 30% better recall of what they’d studied.”
- If you fix the question, how much person-to-person consistency is there in the data? What types of exception do there seem to be? Are there dependencies among the questions? What are the best-case and worst-case questions?
- If you fix the person, how much heterogeneity is there in the data? What’s going on if one person finds a question forces forgetting, but another person does not? Are there examples where one question forces forgetting on one person, but it’s actually remembered forever by another?
- Do response times predict successful recall? If we imagine that knowing the answer within a few seconds corresponds to high efficacy, can we use response time as a more continuous measure than the discrete right/wrong measure?
- How time-stationary is the process here?
- What does spaced repetition do to question half-lives? Is there a (plausible, approximate) universal law here, which is independent of the question and of the person? It will presumably still be (at least weakly) dependent on the environment. e.g. “successful review increases half-life by a typical range of 150-200%”.